A Guide to DSCR Loans for Real Estate Investors
If you're a landlord or considering purchasing a rental income property, consider a debt service coverage ratio (DSCR) loan to fund your next purchase.
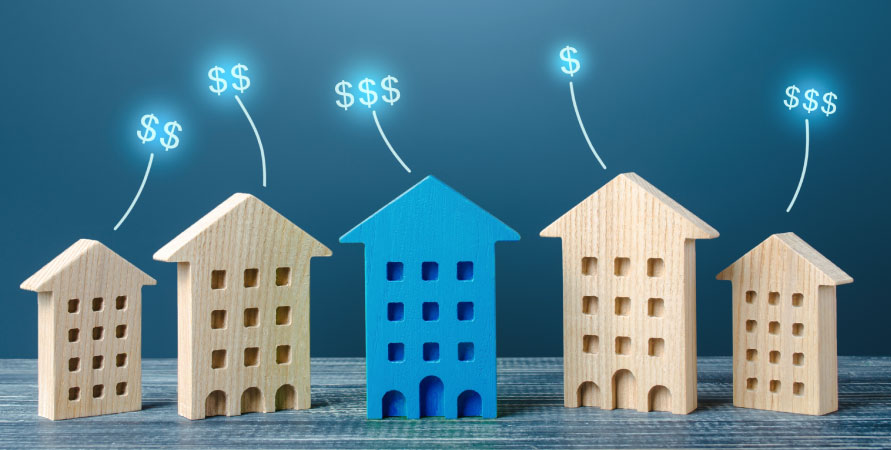
A DSCR loan is specifically designed to finance rental properties and can be easier to qualify for than a conventional mortgage, as it leverages the property's cash flow instead of a buyer's income, tax returns, and W-2.
This article will cover the finer points of DSCR loans, including their requirements, qualification process, and flexibility for real estate investors.
What is a DSCR Loan?
DSCR loans are mortgages secured by the property's rental income and do not require the buyer to provide the same documentation needed with a mortgage for owner-occupied properties.
This feature is especially helpful for self-employed investors who may not have a conventional income stream or have been challenged to obtain financing through traditional banks.
DSCR loans are specifically designed for residential income-producing properties and are quickly becoming the preferred option for investors purchasing income properties. Still, there are some considerations regarding DSCR loans:
Only properties with one to four units are eligible for DSCR lending, as additional units in the building would classify it as "multi-family."
Most DSCR lenders prefer turnkey or stabilized properties, though some allow light rehab if the property is leased or stabilized quickly.
Lastly, the property must be a business asset or income investment, meaning the owner cannot reside at the address.
How DSCR Loans Are Calculated
DSCR loans are based on a calculation that assesses the property's potential to cover its expenses. The calculation divides the property's net operating income (NOI) by its total debt service (TDS) to obtain a number less than, greater than, or equal to 1.0.
DSCR = Net Operating Income (NOI) / Total Debt Service (TDS)
Net operating income is calculated by subtracting the total operating expenses from the gross rental income. Total debt service refers to the sum of all debt-related costs that the property is required to pay.
The DSCR ratio is what tells the borrower and lender how much income the property is generating to cover (or not cover) its own expenses.
DSCR > 1 means the property is generating enough income to cover its debt.
DSCR = 1 means the property is just breaking even with enough income to cover its debt.
DSCR < 1 means the property isn't generating enough income to cover its debt, posing a greater risk for lenders.
For Example:
DSCR = $150,000 / $100,000 = 1.5
This means the property generates $150,000 in income, with total expenses equal to $100,000. This results in a DSCR of 1.5, so the property yields 50% more income than what's needed to cover its debt, making it a more acceptable threshold for a lender to consider financing.
DSCR Loan Requirements: What Lenders Look For + Refinance Outlook
Recently, rates have eased into the mid-6% to 7% range on average, and liquidity from non-agency or non-QM channels has improved.
At the same time, rents are increasing unevenly by metro area, and insurance costs remain elevated in some counties. Key factors driving uneven rent increases can include:
Supply and demand.
Migration patterns.
Construction costs.
Location desirability.
Inflation.
Post-pandemic changes.
All of this is reflected in today's DSCR underwriting. Lenders are pricing more competitively than in previous years, but they're also scrutinizing expenses such as taxes and homeowners' insurance that impact cash flow.
Core DSCR requirements (what you'll typically need) and LendingOne's impact:
Property & use: 1-4 unit single-family rentals (SFRs), townhomes, condos, and planned unit developments (PUDs); investment use only (non-owner-occupied).
DSCR threshold: Many programs target a DSCR of ≥1.10-1.20, depending on the credit; some offer options for break-even or even sub-1.0 DSCR with compensating factors.
Example: LendingOne's core grid lists 1.10-1.20 minimums by FICO; separate programs advertise flexibility for break-even and negative cash-flowing properties. Always confirm program-specific guidelines.
Leverage: This is program-dependent, but LendingOne, for example, offers up to 80% LTV on purchase or rate/term refi; up to 75% LTV on cash-out.
Credit & experience: Program minimums vary; one representative grid shows a minimum FICO score of 680, with stronger credit resulting in a lower required DSCR and potentially reduced reserve needs. Some programs require experience with existing investment properties.
Reserves & payment structure: Expect reserves (e.g., ~9 months PITIA), with portions sometimes collected at closing and potential waivers for higher FICOs. Prepayment options often include 1-5-year step-downs, which is vital if you plan to refinance.
Appraisal & rents: Full appraisal with 1007 rent schedule; lenders qualify using the lesser of actual or market rent (caps may apply).
Insurance & escrows: Escrows for taxes and insurance are standard. Hazard insurance (and flood, if applicable) is required; many lenders also require rent-loss coverage (e.g., six months). Rising premiums, especially in high-risk counties, can tighten DSCR, so get quotes early.
DSCR Loan vs. Other Investment Property Loans
Choosing the right loan comes down to how the deal cash flows, how quickly you need to close, and how much documentation you are willing to provide. Of course, this is easier said than done, and verifying many variables can get overwhelming.
This is how DSCR loans compare with other standard options. This table focuses on general patterns across lenders. Terms vary by program and market.
Loan type
Qualifying focus
Docs & credit
Typical LTV & term
Rate & fees (relative)
Best fit
DSCR Rental loan
Property income (DSCR) is more than the borrower’s DTI
Appraisal + rent schedule; credit & reserves reviewed
~75–80% LTV; 30-year fixed or ARM; IO options
Higher than conventional; lower than most short-term loans
Long-term holds when you prefer property-based underwriting
Conventional (agency) investment mortgage
Personal income & DTI
Full income and asset docs; strong credit needed
LTV caps vary by units and purpose; 15–30-year terms
Lowest if you fully qualify
Lower-cost debt for well-documented borrowers
Bridge loan
Asset + exit plan (sale or refinance)
Appraisal and BPO; business plan; experience and liquidity
Short term (~6–18 months); leverage varies
Higher rates and points
Fast acquisitions or seasoning before permanent debt
Fix and Flip (rehab) loan
After-repair value (ARV) and scope
Budget, draws, inspections; experience helps
Short term (~12 months); leverage tied to LTC or ARV
Higher (construction risk priced in)
Buy-rehab-sell or refi to DSCR after stabilization
Portfolio or blanket rental loan
Portfolio cash flow (global DSCR)
Rent rolls, consolidated financials, entity structure
Often up to ~75% LTV; 5–10-year terms (balloon or fixed and ARM)
Middle of the pack
Operators consolidating multiple rentals under one loan
Disclaimer: This information is provided for educational purposes. Always check the current guidelines, fees, prepayment terms, and local insurance and tax impacts before bidding or refinancing.
Should You Use a Direct Lender, Broker, or Bank for Your DSCR Loan?
When financing a rental, the company you work with can significantly impact the speed, pricing, and amount of paperwork required. This is how the three options differ and when each is most suitable.
What Is a Direct Lender?
A direct lender is the company that funds the loan itself. In plain terms: The lender makes the loan; a broker does not. Brokers act as intermediaries who help you shop with multiple lenders.
How does this play out with DSCR loans? Direct lenders primarily underwrite based on the property's debt service coverage ratio, order the appraisal and rent schedule, and issue terms directly.
Banks can also be direct lenders, but many DSCR programs are offered by non-bank lenders that specialize in investment properties. Banks engage in mortgage banking — originating, holding, or selling loans.
Example of a Direct Lender: LendingOne
LendingOne is a direct private lender focused on real estate investors, offering DSCR rental loans among other investor products. It lends on non-owner-occupied 1-4 unit properties and provides an online application and borrower portal. For specifics on programs, see DSCR Rental Loans.
Comparing Direct Lenders, Brokers, and Banks
Approval speed
Direct lender: Often faster because underwriting, disclosures, and conditions stay in one shop.
Broker: Timeline varies; brokers coordinate with a wholesale lender's underwriting.
Bank: Processing may be slower due to more thorough documentation and portfolio or committee reviews.
Loan Variety
Direct lender: Deep menu of investor-focused products (DSCR, bridge, flip) within its own credit box.
Broker: Broad market access; can shop multiple wholesale lenders for niche scenarios.
Bank: Strong for conventional or agency and portfolio products; may have fewer DSCR options.
Rates and fees
Direct lender: Competitive for its programs; pricing set in-house.
Broker: Can help you compare offers; broker compensation and fees may apply in addition to lender fees.
Bank: Often sharp pricing if you qualify under bank or agency rules.
Documentation
Direct lender: DSCR loans emphasize property income (from leases and market rent) plus credit, reserves, and entity documents.
Broker: Documentation depends on the target lender's program.
Bank: Heavier personal income and DTI documentation for many programs.
How to Decide
Choose a direct lender if you want a streamlined DSCR process and clear, program-specific guidance from the funding source.
Choose a broker if you want help shopping for multiple DSCR and investor programs with a single intake.
Choose a bank if you easily qualify for conventional or portfolio terms and want potential relationship pricing or servicing under one roof.
Financing Options for DSCR Loans
Within DSCR financing, loan structure directly impacts payment stability, cash flow, and when it makes sense to refinance. Here's what investors should keep in mind:
Fixed-rate (usually 30-year): Stable payment for the full term; good for long holds and budgeting. Often starts a bit higher than ARMs; you'd refinance to benefit from future rate drops.
Adjustable-rate (5/6, 7/6, 10/6 ARMs): Offers a lower start rate, which is fixed for an initial period; then adjusts with caps. Works when you plan to sell or refinance in 3-10 years or expect rates to ease.
Interest-only (IO) periods: Interest only for 5-10 years, then amortizing. Improves near-term cash flow and DSCR; no principal paid during IO; payment jumps when amortization begins. Some lenders size DSCR to the post-IO payment.
Term & amortization: 30-year standard; some offer 40-year with an IO period. Confirm which payment (IO vs. post-IO) is used to qualify.
Down payment/LTV: Purchases typically have a 75-80% LTV (approximately 20-25% down). Cash-out refinancing often caps lower. Results vary by DSCR, credit, reserves, property, and market.
Prepayment: Step-downs are common (e.g., 3-2-1 or 5-4-3-2-1). Match the penalty window to your hold period.
Recourse, entity, assumability: Most close to an LLC with personal guarantees; non-recourse exists at tighter terms. Assumability is lender-specific and not always offered.
Short-term rentals: Many programs allow STRs but may underwrite to market rent or an average history. Model higher expenses (management, cleaning, vacancy) in DSCR.
DSCR Loan Pros and Cons
DSCR Pros
Easier qualification for many investors: Underwrites to the property's cash flow rather than your personal income, tax returns, or W-2s — helpful for self-employed borrowers or those with complex finances.
Faster path to scale: Because income docs are lighter, approvals can be quicker than traditional bank mortgages (still subject to appraisal and underwriting).
Entity-friendly: Allows LLC or partnership ownership, making it straightforward to buy with partners and separate business from personal assets.
Investment-focused: Explicitly designed for non-owner-occupied properties, aligning the loan with portfolio goals.
DSCR Cons
Higher cash to close: Down payments are often larger than conventional mortgages (and cash-out limits may be tighter).
Pricing and fees: Expect higher interest rates, closing costs, and lender fees versus many bank and agency loans due to the risk profile and reduced personal income verification.
Prepayment penalties: Many programs include a step-down prepayment, which can limit the flexibility of early sale or refinance.
Not government-backed: Fewer protections than agency loans; terms vary by lender, and guidelines can change.
Cash-flow risk: If rents soften or expenses rise, such as taxes, insurance, or HOA fees, the DSCR can fall below 1.0, increasing the risk of financial stress or foreclosure.
Market fit matters: Not ideal for properties with unstable income or in volatile markets where vacancy or rent swings are common.
Is a DSCR Loan Right for You?
DSCR loans offer incredible flexibility and are fast becoming the preferred loan vehicle for residential real estate investors today. Working with a lender well-versed in DSCR financing will give you the expertise and options you need to achieve your investment goals.
Ultimately, DSCR loans may be a better option for self-employed investors, investment partnerships, or in scenarios where the property's income potential comfortably exceeds its expenses.
However, a conventional mortgage may be a more suitable and affordable choice for first-time buyers or anyone who plans to live in the property.
For more information, explore the loans available for your next real estate investment.
CTA button: Speak with a LendingOne Loan Advisor