Insights
Real estate investing trends, strategies, and lending insights from LendingOne.
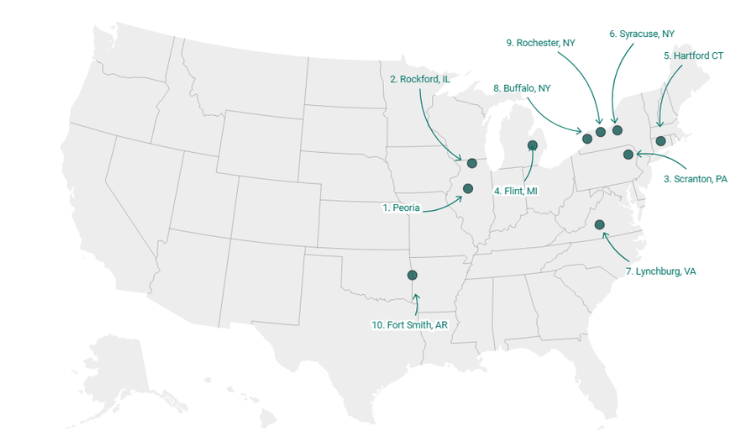
Top 10 Markets for Fix and Flippers in 2026
February 16, 2026
Real estate investing trends, strategies, and lending insights from LendingOne.
February 16, 2026