The 2025 real estate investing environment is one of cautious optimism, with a desire to still expand their portfolio. A belief for higher-for-longer interest rates, uncertainty related to tariffs, and cost increases that are reshaping portfolio decisions across the U.S.

In this article, you’ll see the full results of our LendingOne-ResiClub SFR Investor Survey–Q2 2025. Investors who own at least one single-family investment property were eligible to respond to our survey, which was fielded between May 29 and June 13. In total, 222 single-family landlords completed the survey. ResiClub, our partner for the survey, is a news and research outlet dedicated to covering the U.S. housing market.

LendingOne’s findings point to investors seeking selective growth. Most respondents across all regions say they still plan to acquire new properties in the 12 months ahead, and investors are not pricing in a drop in renter activity—at least not in their local markets. Even in markets like the Southeast and Southwest, where investors say the market is weaker, they also respond that they are trying to purchase more.  At the same time, rising insurance premiums, property taxes, and higher-for-longer interest rates are forcing investors to reassess margins, stress test cash flow, and stay disciplined on acquisitions.

“In 2025, real estate investing is about finding opportunity in a changing market,” says LendingOne CEO Matthew Neisser. “Our survey highlights that investors are not backing down despite the ‘higher-for-longer’ interest rate environment and rising costs. Instead, they see the initial signs of buying opportunities as inventory levels increase. There will be more opportunities in Q3/Q4 for unsold properties that have been on the market longer than normal compared to the prior few years.”

Topline Findings

1. Most investors plan to buy—despite headwinds

  • 80% of single-family landlords say they’re likely to buy at least one property in the next 12 months.
  • 32% of single-family landlords say they’re likely to sell at least one property in the next 12 months.
  • 57% of investors believe mortgage rates will remain above 6.5% over the next 12 months—up sharply from 29% in Q4 2024.

2. Operating costs are rising—especially insurance

  • 59% of landlords say higher insurance premiums have moderately (42%) or significantly (17%) reduced their cash flow over the past year.
  • 30% of investors said property taxes were their largest expense increase last year, followed closely by 29% who cited home insurance.
  • In the West, 19% of landlords report insurance premiums have risen more than 50% over the past five years.

3. Rent growth is still on the table

  • 83% of landlords plan to raise rents in the next 12 months—but only 10% of landlords expect rent hikes of more than 7%.
  • Only about 12% of respondents expect rental demand to weaken over the next year, while 89% expect it to remain steady or improve. 

Big picture: The results of the LendingOne–ResiClub SFR Investor Survey (Q2 2025) point to a market where most single-family rental investors remain in cautious acquisition mode. With borrowing costs still elevated and operating expenses rising, investors are adjusting their strategies and attempting to modestly raise rents to offset pressure on cash flow. In today’s environment, successful investing requires discipline—and those best positioned are focused on long-term fundamentals.

Likelihood of Buying in the Next 12 Months

Likelihood of Buying in the Next 12 Months (Q2 of 2024 to Today)

Likelihood of Selling in the Next 12 Months

Impact of Rising Insurance on SFR Investor Cash Flow

5-Year Insurance Cost Changes

How SFR Investors View Home Price Momentum (12 Months)

How SFR Investors View Rental Demand Over the Past 12 Months

How SFR Investors Expect Rental Demand to Be In the Next 12 Months

How Much SFR Investors Plan to Raise Rents in the Next 12 Months

Expected Home Price Changes Nationally Over the Next 12 Months

Expected Home Price Changes Locally Over the Next 12 Months

Expected 30-Year Fixed Mortgage Rates Next 12 Months

Rental vacancy levels vary significantly across U.S. metros as local supply pipelines, population growth, and other market dynamics pull vacancy rates in different directions. In some markets, a flood of new units, ushered in during the Pandemic Boom building frenzy, has outpaced demand, pushing vacancies higher. In other markets, limited new construction and steady renter demand are keeping vacancies low and rents competitive.

Why Vacancy Rates Matter for DSCR Loans

DSCR loans—designed for financing income-producing rental properties—depend on one key metric: how well the property’s cash flow covers its debt obligations. For this reason, rental vacancy rates should be a key indicator for real estate investors if they are considering this type of loan.

In tightening markets, vacancy rates are falling and rental income is strengthening, creating a more favorable environment for these loans. In softening markets, rising vacancies can limit cash flow and make it harder to meet loan requirements.

🏢 Tip from a DSCR lender: Lower vacancy means stronger rental performance, which improves your debt service coverage ratio—an essential qualifier for DSCR financing.

Where Vacancies Are Rising or Falling Most

LendingOne analyzed the latest U.S. Census Bureau data to identify the metros where rental vacancies are rising—and where they’re falling—to help investors assess where DSCR loans may be most viable.

Here are our top-line findings:

  • The U.S. rental vacancy rate rose to 7.1% in Q1 2025, up from 6.6% a year earlier—marking the highest level in six years.
  • Among the largest 50 U.S. metros, Milwaukee, WI and Kansas City, MO saw the steepest year-over-year vacancy increases (+9.0 and +5.8 points, respectively).
  • Metros with the lowest rental vacancy rates in Q1 2025 include Providence, Richmond, and California markets like Riverside, San Diego, San Jose, and Los Angeles—all below 4%.

U.S. Rental Vacancy Rates

The U.S. rental vacancy rate reached 7.1% in Q1 2025, marking its highest level since Q3 2018—perhaps the aftermath of Pandemic Boom-era construction activity, shifting migration patterns, and economic conditions affecting renters’ affordability.

📉 For investors, this trend suggests a more competitive rental market, potentially leading to lower rents and increased incentives to attract tenants. However, opportunities may exist in regions with stable demand and limited new supply.

Rental Vacancy Rates for America’s 50 Largest Metro Areas


These are the 5 metros with the highest vacancy rates:

  • Milwaukee-Waukesha, WI: 14.5%
  • Kansas City, MO-KS: 12.5%
  • Birmingham, AL: 12.3%
  • Tampa-St. Petersburg-Clearwater, FL: 11.9%
  • Houston-Pasadena-The Woodlands, TX: 11.6%

These are the 5 metros with the lowest vacancy rates:

  • Providence-Warwick, RI-MA: 2.2%
  • Riverside-San Bernardino-Ontario, CA: 3.4%
  • San Diego-Chula Vista-Carlsbad, CA: 3.7%
  • Richmond, VA: 3.8%
  • San Jose-Sunnyvale-Santa Clara, CA: 3.8%

Beyond this snapshot of vacancy rates, it’s critical to examine where vacancies are rising and falling across the country to understand the trajectory of rental supply and demand. In markets like San Francisco or New York City, vacancy levels are likely to remain lower than the national average due to sustained demand driven by limited housing supply, high population density, and a robust job market.

Therefore, investors need to adopt a dynamic view of vacancy trends to assess long-term cash flow potential and risk, ultimately determining if the market is ripe for DSCR loan opportunities.

Investors seeking DSCR loans may benefit from investing in low-vacancy markets with stable demand and limited new construction.

Year-over-year rental vacancy rate shifts

These are the 5 metros with the largest vacancy increases:

  • Milwaukee-Waukesha, WI: +9.0%
  • Kansas City, MO-KS: +5.8%
  • Grand Rapids-Wyoming-Kentwood, MI: +5.6%
  • Sacramento-Roseville-Folsom, CA: +5.3%
  • Hartford-West Hartford-East Hartford, CT: +5.1%

These are the 5 metros with the largest vacancy decreases:

  • Richmond, VA: -4.6%
  • Las Vegas-Henderson-North Las Vegas, NV: -3.7%
  • Providence-Warwick, RI-MA: -3.5%
  • Raleigh-Cary, NC: -3.2%
  • Virginia Beach-Chesapeake-Norfolk, VA-NC: -3.2%

📌 Metros with falling vacancy rates, like Richmond and Las Vegas, indicate stronger rental demand—ideal for DSCR lenders and real estate investors looking to optimize financing.

Investor Takeaway: Align Vacancy Trends With DSCR Strategy

If vacancy rates continue to rise in high-supply metros, it may pose challenges for investors using DSCR loans, as weaker cash flow can affect loan eligibility.

Conversely, metros with falling vacancy rates often offer:

  • Higher rent stability
  • Stronger DSCR coverage ratios
  • Better conditions for securing financing with a DSCR lender

Still, investors should consider other factors such as local job growth, economic resilience, and pricing trends before investing.

Final Word for DSCR Loan Investors

Big Picture: With rental vacancy rates reaching a six-year high, investors must understand where supply and demand are shifting to evaluate DSCR loan viability.

  • Markets with rising vacancies present more risk.
  • Markets with tightening vacancies create favorable conditions for long-term, cash-flowing investments.

Whether you’re a new or experienced investor, aligning market data with your DSCR strategy can make or break your next deal.

The U.S. rental market has cooled off since the red-hot heights of the Pandemic Housing Boom when national multifamily rents surged +16.4% and single-family rents jumped +13% year-over-year in the early months of 2022.

However, the slowdown has not been uniform. Last year, many U.S. rental markets saw multifamily rent growth continue to lag behind single-family rental growth, with some regions even seeing outright declines. Early data for 2025 suggests this trend is continuing. 

According to LendingOne’s analysis, nationally aggregated multifamily rents rose +2.7% year-over-year in January 2025, while single-family rents climbed +4.4%. 

This growth gap indicates that demand for single-family rentals remains elevated, while multifamily rent growth faces more downward pressure—with the strength of this trend varying greatly by market. 

To see which multifamily and single-family rental markets have seen the most rent growth in the last 12 months, LendingOne analyzed data from the Zillow Observed Rent Index (ZORI). Using the ZORI time series data, LendingOne analysts calculated the year-over-year shifts in rent for single-family and multifamily properties by metro area.

Top-line findings from LendingOne’s latest rent analysis:

  1. Single-family rental growth, while subdued compared to the Pandemic Housing Boom days, continues to outperform multifamily rental growth across most U.S. markets. 
  2. Small and mid-sized markets in the Northeast and Midwest are seeing the strongest rental growth—for both multifamily and single-family properties.
  3. The weakest rental markets are concentrated in the Southeast, with markets like Austin, Cape Coral, and San Antonio experiencing outright multifamily rent declines since January 2024.


National Rent Change: 12-Month Shift


Change in Metro-Level SFR Rents Between January 2024 and January 2025


Top Metros for Single Family Rent Growth

Among the 200 largest metros with sufficient data, these are the 20 metros with the highest single-family rent growth from January 2024 through January 2025:

  1. Atlantic City, NJ: +14.4%
  2. Manchester, NH: +10.9%
  3. Reading, PA: +10.4%
  4. Huntington, WV: +9.7%
  5. Salinas, CA: +9.6%
  6. Santa Cruz, CA: +9.6%
  7. Flint, MI: +9.4%
  8. Green Bay, WI: +9.3%
  9. Kalamazoo, MI: +9.1%
  10. Evansville, IN: +9.0%
  11. Norwich, CT: +8.3%
  12. Topeka, KS: +8.1%
  13. Fort Smith, AR: +7.9%
  14. Salisbury, MD: +7.7%
  15. St. Louis, MO: +7.7%
  16. Cleveland, OH: +7.6%
  17. Charleston, WV: +7.6%
  18. Santa Maria, CA: +7.4%
  19. Youngstown, OH: +7.4%
  20. Merced, CA: +7.2%

Atlantic City, NJ stands out as the strongest single-family rental market, with a remarkable year-over-year rent growth of +14.4%. Many of the city’s Northeastern neighbors, including Manchester, NH (+10.9%) and Reading, PA (+10.4%), join it at the top of the ranks. This region is strong due to tight housing inventory, limited new construction, expensive neighboring cities, and home price appreciation pushing up rental demand.

The Midwest is also performing well, with cities like Flint, MI (+9.4%) and Kalamazoo, MI (+9.1%) seeing strong single-family rent growth. The region's relative affordability and increasing demand for rental properties as more people seek budget-friendly housing options amid rising homeownership costs puts upward pressure on rent growth. 

Notably, select areas in California are seeing strong single-family rent growth as metros like Salinas (+9.6%) and Santa Cruz (+9.6%), due to limited housing supply and high demand.


Change in Metro-Level Multifamily Rents Between January 2024 and January 2025

Top Metros for Multifamily Rent Growth

Among the 200 largest metros with sufficient data, these are the 20 metros with the highest multifamily rent growth from January 2024 through January 2025:

  1. Reading, PA: +12.8%
  2. Atlantic City, NJ: +12.0%
  3. Lynchburg, VA: +9.5%
  4. Erie, PA: +9.1%
  5. Duluth, MN: +9.0%
  6. Hartford, CT: +8.8%
  7. Shreveport, LA: +8.6%
  8. South Bend, IN: +8.6%
  9. Worcester, MA: +8.5%
  10. Tuscaloosa, AL: +8.3%
  11. Salinas, CA: +8.2%
  12. Bremerton, WA: +8.1%
  13. Bridgeport, CT: +8.0%
  14. Fayetteville, AR: +8.0%
  15. Peoria, IL: +7.9%
  16. Montgomery, AL: +7.8%
  17. Norwich, CT: +7.8%
  18. Charleston, WV: +7.8%
  19. Jackson, MS: +7.8%
  20. Lansing, MI: +7.7%

The Northeast and Midwest are home to the strongest markets for year-over-year multifamily rent growth. Reading, PA leads with +12.8% year-over-year rent growth, followed by Atlantic City, NJ (+12.0%) and Lynchburg, VA (+9.5%). 

Meanwhile, the weakest rental markets—for both multifamily and single-family rent growth—tend to be those that overheated during the pandemic boom times. In metros across Texas, Florida, Colorado, and Utah, a large wave of new apartment and single-family construction was delivered in 2023 and 2024, largely driven by multifamily projects and a homebuilding frenzy financed during the period of ultralow interest rates. Some of the downward pressure on rents in these markets could ease as more new inventory is absorbed. 

That being said, even in the softer rental markets, single-family rental growth is still faring better than multifamily with 26 metros seeing outright declines in multifamily rents from January 2024 to January 2025, versus only two markets seeing single-family rents drop in that time, according to LendingOne’s analysis. 

Big Picture: This year is positioned for another year of single-family rent growth outpacing multifamily rent growth in both the strongest rental markets in the Northeast and Midwest, as well as softer markets across Texas and Florida, where new construction has put downward pressure on rent growth. 


Note: The ZORI index is a repeat-rent index that tracks typical market rates by averaging listed rents in the 35th to 65th percentile range, weighted to reflect the full rental housing stock rather than just current listings. 

Over the past few years, U.S. housing affordability has significantly worsened. The aftermath of the Pandemic Housing Boom saw home prices soaring, mortgage rates more than doubled, and the cost of repairs, insurance, and property taxes also shot up. That’s all led to fewer people being able to afford to buy homes, and as a result, homeownership has decreased in some markets.

With higher financial barriers to buying a home, in many markets, a larger share of households have turned to renting instead. This bump in rental demand presents potential opportunities for real estate investors, particularly in metros where renting has become more prevalent.

To see which markets are more primed for investor activity, LendingOne analyzed year-over-year changes in the rental share of housing units—or “rentership”— across the 75 largest metros by population.

LendingOne’s Topline Findings:

  • 47 of the largest 75 U.S. metros saw year-over-year growth in their rental share.
  • Renting remains the most popular in the most expensive housing markets, namely San Jose, Los Angeles, and New York City
  • The metro areas that made the biggest year-over-year rental share gains were Toledo, Cape Coral, and Minneapolis. 

Top Five Metros with the Most Rentership Growth Year-Over-Year:  

  1. Toledo, OH (+8.7 percentage points)
  2. Cape Coral-Fort Myers, FL (+8.5 percentage points)
  3. Jacksonville, FL (+7.7 percentage points)
  4. Minneapolis-St. Paul-Bloomington, MN-WI (+7.7 percentage points)
  5. Portland-Vancouver-Hillsboro, OR-WA (+7.0 percentage points)

Annual Shift in the Share of Local Households that are Renters

Population Growth and Housing Trends

In general, most markets see both the number of homeowners and the number of renters increase over time as the overall population ticks up. However, if the pace of renter household formation significantly outpaces owner household formation, then that could indicate a deterioration in home affordability in that region. 

Affordability Pressures in Growing Renter Households

While populations tend to grow across both renters and homeowners, when renter household formation significantly outpaces owner household formation, it signals that home affordability is deteriorating. In metros like Toledo and Cleveland, home prices have outpaced wage growth, making homeownership increasingly difficult. 

In places like Jacksonville and Cape Coral, soaring home insurance premiums and condo HOA fees are pricing out many would-be buyers, causing the share of renters to rise. 

Consistent Trends in High-Rental-Share Metros

Despite these shifts, the metros with the highest rental shares remain largely consistent, reflecting long-standing trends in affordability. The most expensive markets, with limited housing supply, tend to have the highest rental share. Meanwhile, more affordable areas with room for new development typically see lower rentership rates and higher homeownership.

Five metros with the largest rental share in Q3 2024:

  1. San Jose-Sunnyvale-Santa Clara, CA (52.0%)
  2. Los Angeles-Long Beach-Anaheim, CA (50.8%)
  3. New York-Newark-Jersey City, NY-NJ-PA (49.1%)
  4. San Diego-Carlsbad, CA (48.0%)
  5. Fresno, CA (47.4%)

Five metros with the smallest rental share in Q3 2024:

  1. Cape Coral-Fort Myers, FL (21.8%)
  2. Charleston-North Charleston-Summerville, SC (23.7%)
  3. Columbia, SC (24.5%)
  4. Allentown-Bethlehem-Easton, PA-NJ (27.2%)
  5. Detroit-Warren-Dearborn, MI (28.2%)

Share of Local Households that are Renters

Big Picture: As housing affordability conditions worsened over the past few years, the share of renting households has ticked up a bit in some markets, creating opportunities for investors.

If you’re getting started as a real estate investor, you may have heard about the BRRRR method. BRRRR stands for Buy, Rehab, Rent, Refinance, Repeat and is a popular five-step investment strategy.

The BRRRR method involves purchasing distressed or undervalued properties, renovating/rehabbing them, and renting them to tenants. Once rehabbed and rented, the property gains value, which the investor can leverage to refinance, using that money to purchase another property so they can repeat the process.

Let’s dive into each step of the process and talk about the advantages, challenges, and financing options investors should know before getting started.


What is the BRRRR Method?

One of the prerequisites to the BRRRR strategy is that the property is purchased below market value. This is an essential component, as you’ll need to build enough equity to recover your original investment quickly.

Here are some points to consider in each step in the BRRRR method:  

Buy

Step 1 in the BRRRR method is Buy. You’ll need to identify a suitable property first. Ideally, it will be one that requires some upgrades but still has desirable qualities that make it worth the investment. Potential is key! A distressed property in a great location is one example, or perhaps a building that’s under foreclosure or bank-owned.

Be sure to conduct a thorough inspection before you commit. A good rule of thumb is not to purchase any property for more than 70% of its post-rehab value. That gives you a 30% buffer for repairs, and you’ll still have enough equity for a refi when you’re done. This is occasionally called the 70% rule or the maximum allowable offer (MAO). MAO is the maximum you can pay upfront and still make a profit.

Other metrics investors typically use to evaluate deals include the after-repair value (ARV). You can estimate this amount by adding the added value from the repair to the purchase price or by looking at similar properties in the area to gauge the fair market value.

So, for example, if your ARV is $750,000, your MAO is $525,000.
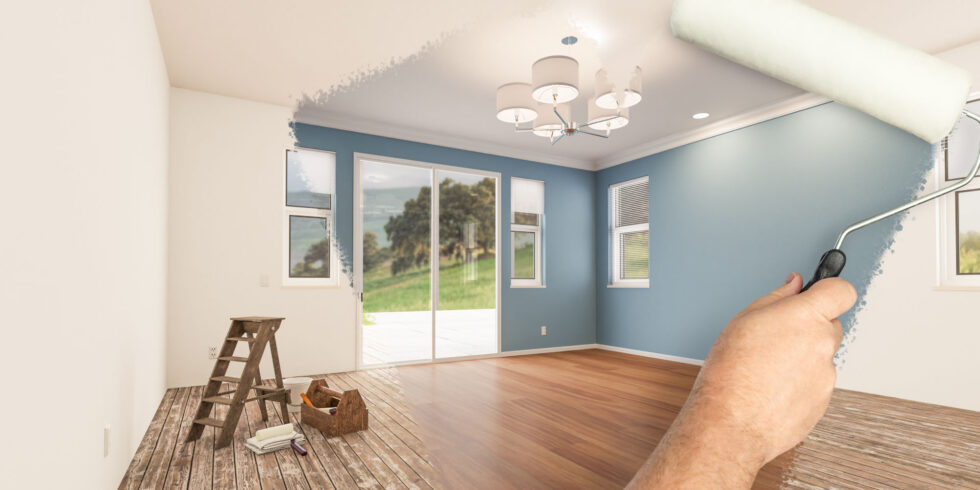
Rehab

Once the deal is completed, it is time to start on step 2 of the BRRRR method: rehabbing the property, upgrading, and repairing it so it’s ready for tenants. Upgrades could be purely cosmetic or more extensive, but the ultimate goal is to make it a desirable place to rent. Choose your upgrades based on what will give you the most bang for your buck. Updating bathrooms and kitchens, finishing basements, new paint, and refinishing floors are just a few examples.

Rent

When your property is ready to occupy, you’ll move on to step 3 in the BRRRR process: finding suitable tenants.  Rental income covers your expenses, so do your due diligence to ensure they will make good tenants who will stay long-term. The rent should be enough to cover your mortgage payments with some profit on top of it. Keep your property maintained, be a responsive landlord, and keep the lines of communication open.

Refinance

Once your property is occupied and income-generating, it’s time to refinance. In step 4 of the BRRRR process, you’ll want to use the equity you’ve built in the property as collateral, and pull out of your initial investment plus whatever additional equity there is so you can repeat the process with a new property. You’ll need to have owned the property for a minimum period before you can refinance, replacing the existing mortgage with a new one at more favorable terms. In the case of a cash-out mortgage, the refinanced amount will be more than what’s owed, and you will receive the balance in cash.

Repeat

The fifth and final step in the BRRRR method is to use the funds you received through your refinance to go back to step 1 and start the process over again. The goal is to keep repeating this same strategy as you build out your overall portfolio for more profit and better returns.


Advantages of BRRRR for Investors

The BRRRR method is an excellent way for investors to scale their portfolios—as long as the variables are in your favor.

The main benefits of the BRRRR method are:

Requires minimal investment. If the property is undervalued enough and you can do most of the rehab work yourself, there is massive profit potential.

High ROI. Depending on what you paid for the property, there’s excellent potential for generating a high return on your investment over time.

Easily scalable. The steps are easy to follow, and if your first property was a success, you’ll have learned from the process and will know what you’re facing for future investments.

Great passive income potential. If you find great tenants, you’re in a good position to achieve steady cash flow.

Equity building. As you build equity through the rehab process, you could net better interest rates, lower payments, and more buying power that you can leverage into new investments.


Challenges of the BRRRR Method

Sometimes, it isn’t so easy to lock into the right circumstances with BRRRR. Here are some of the challenges you could face.

Finding the right property isn’t always easy. The success of your BRRRR strategy hinges on purchasing the right property at the right price. Careful evaluation is essential to ensure your efforts and investment are worthwhile.

It’s speculative. There’s always a chance you won’t find suitable tenants, or the property won’t gain value, putting your investment at risk.

It’s hard work. Managing rental properties isn’t for everyone. It can be extremely time-consuming and stressful, especially with multiple properties or tenants. All the pieces need to be in place to ensure success.

High up-front costs. You’ll need to ensure you can cover the down payment, renovation costs, and operating expenses until the property is income-generating, which could be a barrier for some investors.


Financing Options for the BRRRR Strategy

You have a few options for financing your BRRRR strategy, but a fix to rent loan is recommended as it is tailor-made for BRRRR.

Fix to Rent loans are essentially two loans in one. Investors start with a fix and flip loan that covers both the purchase and repair costs of the property. Once the rehab is complete and the investor is ready to rent the property long-term, you have the option to roll into a 30-year fixed-rate rental loan. Working with the same lender when you are ready for the refinance can prove beneficial as they already have your documents on file, you are familiar with your loan advisor, and they may offer incentives for continuing to work with them.

Ultimately, this is a fast and simple solution for investors looking to purchase income properties they intend to own long-term, which goes to the heart of BRRRR. Speak to a loan advisor to see if you qualify for a fix-to-rent loan.


Final Thoughts on BRRRR

Real estate investing is an excellent way to build wealth and equity, and the BRRRR method may be what you need to achieve your investment goals. Choosing the right financing partner is critical, as success hinges on the right rates and terms. The qualified lending advisors at LendingOne will work with you to ensure you have the best financing vehicles to get you where you want to be. Contact us today, or take a moment to request a quote. We specialize in real estate investment loans and are here to help. 

If you’re a landlord or considering purchasing a rental income property, consider a debt service coverage ratio (DSCR) loan to fund your next purchase. DSCR loans are specifically designed to finance rental properties and can be easier to qualify for than a conventional mortgage as they leverage the property’s cash flow instead of a buyer’s income, tax returns, and W2.

Today’s article will cover the finer points of DSCR loans, DSCR loan requirements, how to qualify, and their flexibility for real estate investors.

What is a DSCR Loan?

DSCR loans are specific to residential income-producing properties and are fast becoming the preferred option for income property buyers. DSCR loans are mortgages secured by the property’s rental income and do not require the buyer to provide the same documentation needed with a mortgage for owner-occupied properties. This feature is especially helpful for self-employed investors who may not have a conventional income stream or have been challenged to obtain financing through traditional banks.

Some things to note about DSRC loans:

  • Only properties with one to four units are eligible for DSRC lending, as additional units in the building would classify it as “multi-family.”
  • DSCR eligibility assumes the property is turnkey, meaning it requires no renovation or upgrades and is move-in ready or has an established, reliable tenant.
  • Lastly, the property must be a business asset or income investment, meaning the owner cannot reside at the address.

How DSCR Loans Are Calculated

DSCR loans are based on a calculation that assesses the potential for the property to cover its expenses. The calculation divides the property’s net operating income (NOI) by its total debt service (TDS) to obtain a number less than, greater than, or equal to 1.0.

Net operating income is calculated by subtracting the total operating expenses from the gross rental income.

Total debt service is the total of all debt-related expenses the property must pay.

The DSCR ratio is what tells the borrower and lender how much income to debt the property is generating to cover (or not cover) its own expenses.

  • DSCR > 1 means the property is generating enough income to cover its debt
  • DSCR = 1 means the property is just breaking even with enough income to cover its debt
  • DSCR < 1 means the property isn’t generating enough income to cover its debt, posing a greater risk for lenders.

Let’s look at an example:

What this means is this property is generating $150,000 in income with total expenses equalling $100,000. This results in a DSCR of 1.5, so the property yields 50% more income than what’s needed to cover its debt, making it a more acceptable threshold for a lender to consider financing.

DSCR Loan Requirements

The criteria for a DSCR loan are vastly different from that of a traditional mortgage. Whereas a bank will want proof of income, a W2, and tax returns and consider your personal credit, a DSCR loan is more concerned with the property’s earning potential.

The buyer must provide the property’s current income and expense reports, a verifiable property appraisal, and a credit check. However, DSCR loans have a much less stringent benchmark for personal credit than would be the case with a conventional mortgage.

Traditional lenders lean more on the buyer’s credit score and income than the property’s income. DSCR loans turn that equation upside down; though the buyer’s personal credit has some weight, it is a minor factor compared to the property’s earning potential.


DSCR Loan Pros and Cons

While DSCR loans are often easier and faster to obtain a mortgage from a bank, there are some caveats to consider.

On the plus side, DSCR loans are an excellent option for investors who do not have a traditional source of income. Since they are strictly used for investment, they can help people quickly build a real estate portfolio without having to prove personal income.

Many investors find DSCR loans helpful when working with other investors as they allow for a shared ownership, making it possible to borrow in partnership with others through an LLC.

Depending on the buyer’s financial situation, there may be drawbacks to DSCR loans. For one, the required downpayment is often higher than would be the case for a traditional mortgage. Higher interest rates, closing costs, and additional fees should also be considered. DSCR loans are considered to be higher risk as they do not require personal income verification, hence, they often come with higher fees. In some cases, there may also be a prepayment penalty, meaning you’re locked into your payments for the loan term.

Additionally, buyers may not have the same protection as a conventional mortgage because government agencies do not back DSCR loans.

The above point underscores the importance of ensuring the property’s income potential holds up, as cash flow problems may lead to financial distress or foreclosure. DSCR loans are not recommended for properties lacking stable income or in areas with challenging or volatile real estate markets.


Is a DSCR Loan Right for You?

DSCR loans offer incredible flexibility and are fast becoming the preferred loan vehicle for residential real estate investors today. Working with a lender well-versed in DSRC financing will give you the expertise and options you need to achieve your investment goals.

Ultimately, DSCR loans may be a better option for self-employed investors, investment partnerships, or in scenarios where the property’s income potential comfortably exceeds its expenses.

However, a conventional mortgage may be a more suitable and affordable choice for first-time buyers or anyone who plans to live at the property.

To learn more about the different types of loans available for your next real estate investment, we’re here to help. Contact LendingOne today.

If you’re a real estate investor looking to expand your portfolio, leveraging your first investment property to finance the second can be a strategic approach to accelerate your growth in the real estate market. Here’s how you can effectively use the equity and cash flow from your first property to step into additional investments.

Understand the Value of Equity

Equity is the value of ownership built up in a property, calculated by the difference between the property’s current market value and the amount still owed on the mortgage. Over time, as you pay down the mortgage and if the property appreciates in value, your equity increases. This equity can be a powerful tool for financing additional properties.

Ways to Tap into Your Equity

  • Home Equity Loan:
    A home equity loan provides you a lump sum, using your existing property as collateral. This can be used for down payments on a second property. It’s a separate loan with its own fixed interest rate and payment schedule.
  • Home Equity Line of Credit (HELOC):
    A HELOC works like a credit card, giving you a credit limit based on your home’s equity, which you can draw from as needed. This flexibility is beneficial if you encounter unexpected expenses or if you’re investing in a property that needs renovations.
  • Cash-Out Refinance:
    This involves refinancing your first property for a higher amount than you owe and taking the difference in cash. This method can potentially secure a lower interest rate and provide substantial capital, depending on the amount of equity you’ve built up.

Evaluate Cash Flow

Before leveraging your first property, it’s essential to evaluate its cash flow — the net amount of cash being transferred in and out, particularly from rental income minus expenses. A positive cash flow can cover the costs of equity loans or additional mortgages, making your investment self-sustaining.

Consider the Risks

Leveraging increases your debt load and can amplify both gains and losses. Ensure that you can manage the additional debt, even in scenarios like tenant vacancies or unexpected property expenses. Always have a contingency plan.

Tips for Using Leverage Wisely

  • Market Research:
    Invest time in researching the market where you plan to buy your second property. Look for areas with strong rental demand and potential for property value appreciation.
  • Investment Property Analysis:
    Conduct thorough analyses of potential properties to ensure they have good prospects for rental income and appreciation. Utilize metrics such as cap rate and cash-on-cash return to evaluate investment performance.
  • Keep Reserves:
    Always maintain adequate cash reserves to cover mortgage payments and property expenses in case of unexpected financial downturns or vacancies.
  • Consult Professionals:
    Seek advice from financial advisors, mortgage brokers, and real estate experts. Professional advice is crucial in making informed decisions that align with your long-term investment goals.

Strategic Growth

Using your first investment property to finance your second can significantly accelerate your portfolio’s growth. This strategy not only allows you to expand more quickly but also diversifies your investments and spreads risk across different properties.

Leveraging your first investment property provides a viable pathway to not just grow your real estate portfolio but also to build wealth over the long term. With organized planning, a clear understanding of the market, and careful financial management, you can potentially unlock new investment opportunities and achieve greater financial success in real estate.

In the ever-evolving landscape of real estate investment, landlords are finding cause for optimism as rising rents outpace home prices in numerous markets across the country. According to ATTOM’s Q1 2024 Single-Family Rental Market Report, this trend is driving up investment returns and presenting lucrative opportunities for real estate investors seeking strategic deals in today’s dynamic market conditions.

The report highlights a notable uptick in rental demand, fueled by a combination of factors including historically limited housing supply and a deceleration in home price appreciation. Between 2023 and 2024, median three-bedroom rents surpassed median single-family home prices in 63% of the markets analyzed, leading to incremental increases in rental yields.

Anticipated average annual gross rental yields for three-bedroom properties are projected to reach 7.55% in 2024, representing a slight uptick from the previous year’s figures. This marks the second consecutive year of rising projections following a period of declines, signaling a resurgence in rental market performance.

Noteworthy growth in rental returns is observed across most regions, with potential annual gross rental yields for three-bedroom properties increasing in 216 out of 341 counties analyzed. Leading this surge are markets such as Taylor County (Abilene), TX, Jefferson County (Birmingham), AL, and Richmond County (Augusta), GA, where yields have seen significant gains.

Furthermore, ATTOM’s report identifies the top 28 single-family rental growth markets, where average wages have risen, and potential rental yields surpass 10%. Notable inclusions on this list are Chicago, Detroit, and Cleveland, underscoring the breadth of opportunities available to investors across diverse markets.

Below are the top counties experiencing the highest rental growth: 

Source: ATTOM, Top 10 Counties for Buying Single Family Rentals in 2024

For real estate investors seeking strategic investment opportunities, ATTOM’s latest findings offer invaluable insights into the evolving dynamics of the single-family rental market. With rising rental yields and promising growth prospects, these trends provide a roadmap for navigating the current market landscape and unlocking lucrative investment opportunities.

ATTOM released their 2024 Rental Affordability Report outlining the top 10 counties with the highest rental rates. Explore the list below for pricing, affordability, market trends, and how these factors are affecting both renters and homebuyers interested in these areas. 


1. Collier County, Florida 

In 2024, Collier County, Florida has a premium 3-bedroom rental price of $8,000, reflecting a substantial commitment for renters with a rental affordability index of 153%. However, real estate investors should note that buying is more cost-effective than renting in this market, as home prices have been rising faster than rents, indicating potential opportunities for long-term appreciation. The Jan-Nov 2023 home sales prices at $770,000 provide historical context, aiding investors in evaluating the trajectory of property values for informed decision-making.


2. Santa Barbara County, California

Santa Barbara County, California, presents a 3-bedroom rental price of $6,950 in 2024, with an affordability index of 131%, emphasizing the relatively high cost of renting. Real estate investors should take note that, similar to Collier County, buying is more cost-effective in Santa Barbara County, as home prices are rising faster than rents. The report reveals the Jan-Nov 2023 home sales prices were $830,000. 


3. Marin County, California 

Marin County, California features a 3-bedroom rental price of $6,000 in 2024, offering relative affordability for renters. In contrast to the previous counties, Marin County stands out as a place where renting is a more viable option, as rents have been rising faster than home prices. The Jan-Nov 2023 home sales prices were reported at $1,644,625. 


4. Westchester County, New York 

Westchester County, New York, within the New York City metropolitan area, presents a 3-bedroom rental price of $5,500 in 2024, with moderate rental affordability at 76%. Real estate investors should note that renting is more favorable in this county, as rents are rising faster than home prices. The report states that Jan-Nov 2023 home sales prices were $809,000. 


5. Orange County, California

Orange County, California, famous for its coastal beauty, features a 3-bedroom rental price of $5,450 in 2024, providing relatively better affordability for renters. Real estate investors should take note that renting is favored in this county, as rents are rising faster than home prices. This sought-after coastal region showcased Jan-Nov 2023 home sales prices of $1,192,500. 


6. Los Angeles County, California

Los Angeles County, one of the most populous in the United States, presents a 3-bedroom rental price of $5,300 in 2024, offering relatively affordable options for renters compared to some other high-rent counties. Real estate investors should consider that renting is favored in this county, as rents are rising faster than home prices. The report revealed that the Jan-Nov 2023 home sales prices in this populous county were $880,000. 


7. Monterey County, California

Monterey County, renowned for its stunning coastline and natural beauty, features a 3-bedroom rental price of $5,145 in 2024 with a favorable rental affordability at 107%. Real estate investors should consider renting as a viable option in this county, given its relatively good affordability, especially as rents have been rising faster than home prices. In Jan-Nov 2023, home sales prices in this California county averaged $830,000.


8. San Mateo County, California

San Mateo County, situated in the tech-centric San Francisco Bay Area, features a 3-bedroom rental price of $5,000 in 2024. Although rental affordability is lower, real estate investors should recognize renting as a viable choice, given the faster-rising rents compared to home prices. The Jan-Nov 2023 home sales prices at $1,780,000 highlight the county’s high-end market and its notable presence in the tech industry. 


9. San Francisco County, California

San Francisco County, showcases 3-bedroom rentals priced at $4,990 in 2024. Despite a challenging rental affordability at 37%, real estate investors should consider renting as a favored option due to rents rising faster than home prices. The county’s job growing market makes it an appealing location for those interested in new career options, as reflected in the competitive housing market with a median home sales price of $1.5 million in early 2023.


10. Riverside County, California

Riverside County, California, features a 3-bedroom rental price of $4,800 in 2024 with a favorable rental affordability at 101%. Real estate investors should note that, despite its apparent affordability, buying is preferred in Riverside County due to faster-rising rents compared to home prices. The county’s accelerated wage growth further enhances its appeal, making it a compelling choice for potential homebuyers seeking investment opportunities in this dynamic California market. In Jan-Nov 2023, home sales prices averaged $586,000. 


Source: ATTOM: Top 10 Counties with the Highest Rental Rates in 2024. Read the full article here.