
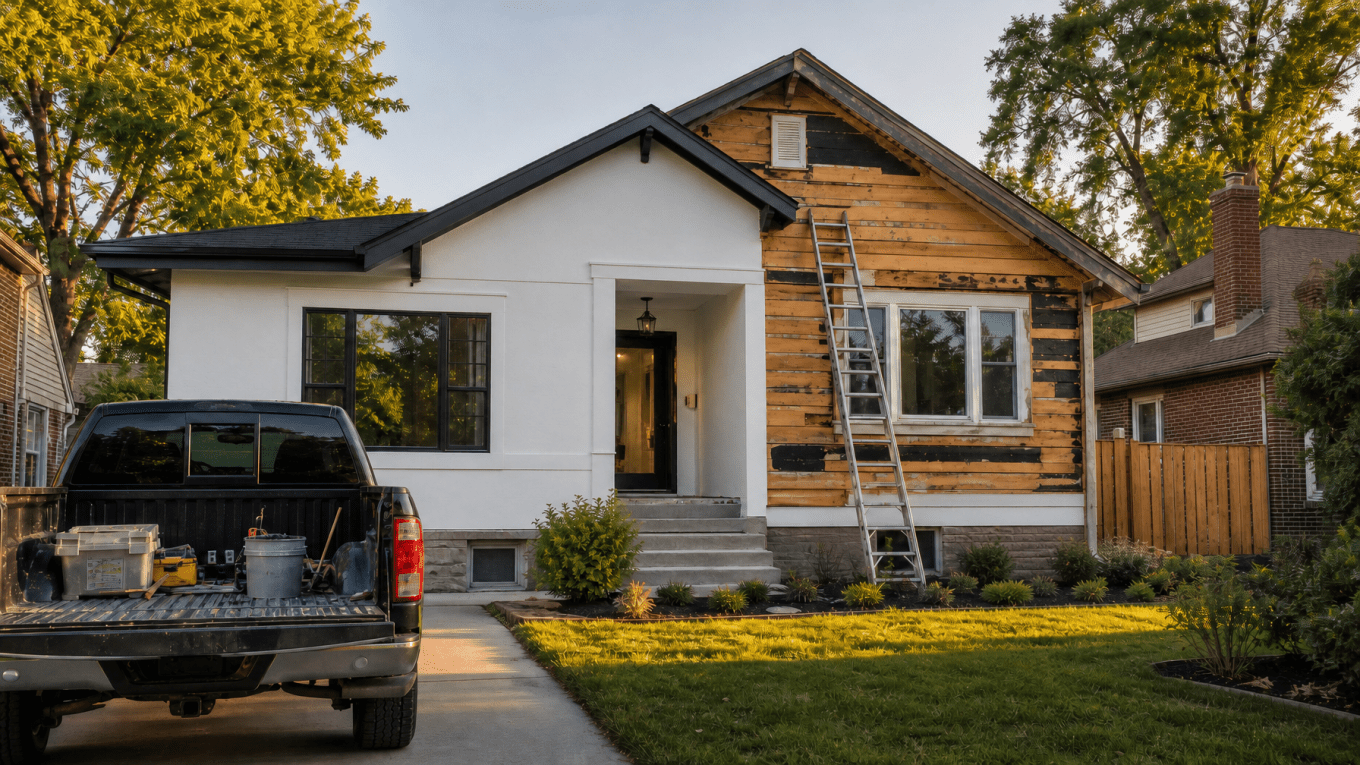
Gross flip margins hit 23.1% in Q3 2025, the lowest since 2008, according to ATTOM's Q3 2025 Home Flipping Report. ATTOM's Q1 2026 report counted 64,348 single-family homes flipped in the first quarter. The RCN Capital/CJ Patrick Investor Sentiment Index, covered by CNBC on August 14, 2026, found that 45% of investors say the market has gotten worse, the highest share in the survey's three-year history.
But 64,348 homes still flipped in a single quarter. The difference between the investors pulling out and the investors still profiting comes down to underwriting discipline, and that applies at every price point from $150K flips in Cleveland to $600K+ renovations in Phoenix and South Florida.
This guide breaks down real deal economics at three price points so you can see how the cost stack, financing structure, and margin drivers shift as deal size increases.
Table of Contents
- Key Takeaways
- The Full Cost Stack of a Flip in 2026
- Three Fix-and-Flip Deal Analyses at Different Price Points
- The Five Numbers That Make or Break a Flip in 2026
- How Fix-and-Flip Loan Structure Affects Your Bottom Line
- The Fix-to-Rent Pivot: When the BRRRR Exit Beats Selling
- Where Fix-and-Flip Deals Still Pencil in 2026
- Frequently Asked Questions
Key Takeaways
- National gross flip margins dropped to 23.1% in Q3 2025, per ATTOM, the lowest since 2008. Financing costs, insurance, and extended hold times are compressing profits across every price tier.
- Gross profit does not equal net profit. After financing, holding costs, closing costs, and rehab overruns, a deal showing $60,000 in gross profit may net $18,000 to $30,000.
- Deals work at every price point when acquisition stays below 65% of ARV, rehab scope is tightly controlled, and hold time is managed aggressively.
- Higher-priced flips carry larger absolute profit potential but require sharper underwriting, faster execution, and disciplined ARV analysis.
- If selling margins are too thin in a particular market cycle, the fix-to-rent (BRRRR) exit into a DSCR rental loan provides an alternative path to returns.
The Full Cost Stack of a Flip in 2026
Most investors calculate gross profit: ARV minus purchase price minus rehab. That number ignores roughly half the costs that determine whether a deal actually makes money.
Here is the complete cost stack for a fix-and-flip project:
| Cost Category | Components | Typical Range |
|---|---|---|
| Acquisition | Purchase price, closing costs (1-2% of purchase), inspection, appraisal | Varies by market |
| Financing | Interest (9-12% on fix-and-flip loans), origination (1-2 points), extension fees | 8-15% of loan amount annualized |
| Rehab | Materials, labor, permits, contingency (15% buffer recommended) | $15/sqft cosmetic to $75+/sqft gut renovation |
| Holding | Insurance, property taxes, utilities, HOA, lawn/security, loan interest | $2,000-$5,000/month depending on price point |
| Selling | Agent commissions (5-6%), buyer concessions (1-3%), transfer taxes, title | 7-9% of sale price |
The categories investors most commonly underestimate: insurance (up 30-50% in Florida, Texas, and California over the past two years), hold time (the average flip took 161 days in Q3 2025 per ATTOM), and compounding financing costs on extended holds.
Three Fix-and-Flip Deal Analyses at Different Price Points
Profitable flips happen at every price tier. The underwriting fundamentals stay the same, but the way capital, risk, and margin interact changes as deal size increases. Here's what each looks like with disciplined execution.
Deal 1: The $210K Cleveland Flip (Entry Price Point)
According to ATTOM's Q3 2025 data, Cleveland-area metros posted some of the highest flip rates in the country. Lower acquisition costs make these markets forgiving for investors building experience.
| Line Item | Amount |
|---|---|
| Purchase price | $120,000 |
| Rehab budget | $35,000 |
| Closing costs (buy side, 2%) | $2,400 |
| Total acquisition + rehab | $157,400 |
| Fix-and-flip loan (90% LTC) | $139,500 |
| Cash out of pocket | $17,900 |
| Loan interest (10.5%, 5 months) | $6,103 |
| Origination (1.5 points) | $2,093 |
| Holding costs (5 months × $1,800/mo) | $9,000 |
| Total project cost | $174,596 |
| ARV (sale price) | $210,000 |
| Selling costs (8%) | $16,800 |
| Net profit | $18,604 |
| Cash-on-cash return | 104% |
| Net ROI on total cost | 10.7% |
What drives this deal: Low acquisition (57% of ARV), manageable rehab scope, five-month hold. The cash-on-cash return is strong because the investor only has $17,900 of their own capital in the deal. Markets like Cleveland, Indianapolis, Memphis, and Pittsburgh consistently produce this profile.
Deal 2: The $425K Tampa Flip (Mid Price Point)
Florida markets carry higher insurance premiums, but Tampa's strong buyer demand and population growth keep ARVs moving. Experienced flippers who manage hold time and buy right still pull consistent mid-five-figure profits.
| Line Item | Amount |
|---|---|
| Purchase price | $255,000 |
| Rehab budget | $60,000 |
| Closing costs (buy side, 2%) | $5,100 |
| Total acquisition + rehab | $320,100 |
| Fix-and-flip loan (90% LTC) | $283,500 |
| Cash out of pocket | $36,600 |
| Loan interest (10.5%, 5.5 months) | $14,428 |
| Origination (1.5 points) | $4,253 |
| Holding costs (5.5 months × $2,900/mo) | $15,950 |
| Florida insurance premium (5.5 months) | $3,300 |
| Total project cost | $358,031 |
| ARV (sale price) | $425,000 |
| Selling costs (7.5%) | $31,875 |
| Net profit | $35,094 |
| Cash-on-cash return | 96% |
| Net ROI on total cost | 9.8% |
What drives this deal: Purchase at 60% of ARV gives enough margin to absorb Florida's higher insurance costs. The 5.5-month hold keeps financing costs manageable. Tight contractor scheduling and an aggressive listing strategy are critical in this price range. The absolute dollar profit ($35K) is nearly double the Cleveland deal on similar capital efficiency.
Deal 3: The $650K Phoenix Flip (Higher Price Point)
Higher price point flips require sharper execution, but they also produce the largest absolute profits per project. Phoenix-area markets reward investors who target specific sub-markets with strong buyer demand at the $500K-$700K range.
| Line Item | Amount |
|---|---|
| Purchase price | $390,000 |
| Rehab budget | $85,000 |
| Closing costs (buy side, 2%) | $7,800 |
| Total acquisition + rehab | $482,800 |
| Fix-and-flip loan (90% LTC) | $427,500 |
| Cash out of pocket | $55,300 |
| Loan interest (10%, 5 months) | $17,813 |
| Origination (1.5 points) | $6,413 |
| Holding costs (5 months × $3,800/mo) | $19,000 |
| Total project cost | $526,026 |
| ARV (sale price) | $650,000 |
| Selling costs (7%) | $45,500 |
| Net profit | $78,474 |
| Cash-on-cash return | 142% |
| Net ROI on total cost | 14.9% |
What drives this deal: Purchase at 60% of ARV on a higher-value property creates substantial margin. The rehab is a full renovation ($85K) that materially changes the property, justifying the ARV jump. An experienced investor with a reliable contractor crew can execute the rehab in 4 months with a month for listing and close. Higher-end buyers are more likely to use conventional financing (fewer appraisal issues) and the investor negotiates a lower commission rate at this price point. The $78K net profit from a single project is four times the entry-level deal.
What Changes as Deal Size Increases
| Factor | Entry ($150-$250K ARV) | Mid ($350-$500K ARV) | Higher ($500K+ ARV) |
|---|---|---|---|
| Margin of error | Forgiving, lower stakes per mistake | Moderate, hold time discipline critical | Tight, every variable must be controlled |
| Holding cost per month | $1,500-$2,200 | $2,500-$3,500 | $3,500-$5,000+ |
| Buyer pool | Broad (FHA, VA, conventional) | Conventional-heavy | Conventional, often cash or jumbo |
| Profit per deal | $15K-$25K | $30K-$50K | $50K-$100K+ |
| Key risk | ARV accuracy in thin-comp markets | Extended hold time in seasonal markets | Overimprovement, commission costs |
| Capital efficiency | Highest cash-on-cash with 90% LTC | Strong with disciplined execution | Strong when acquisition < 62% of ARV |
Experienced investors often run a mix of price tiers. Lower-priced deals provide volume and consistent cash flow. Higher-priced deals provide larger per-project profits that accelerate portfolio growth. The underwriting framework is the same across all tiers: buy right, scope tight, hold short.
The Five Numbers That Make or Break a Flip in 2026
1. Purchase Price as a Percentage of ARV
This ratio determines your margin of safety before you spend a dollar on rehab or financing:
| Purchase-to-ARV Ratio | Margin Assessment |
|---|---|
| Under 60% | Strong margin, can absorb overruns and hold time surprises |
| 60-65% | Solid, the standard target for experienced flippers |
| 65-70% | Thin, requires tight execution and no surprises |
| Over 70% | High risk at current financing rates |
2. Hold Time
Every additional month on a $300,000 fix-and-flip loan at 10.5% costs roughly $2,625 in interest plus $2,000-$4,000 in holding costs (taxes, insurance, utilities). Underwrite for six months minimum, even if you plan to finish in four.
3. Rehab Budget Accuracy
Get three contractor bids. Add a 15% contingency to every budget (up from the old 10% rule of thumb, reflecting 2026 material costs and tariff-related price increases on lumber, steel, and electrical components). Walk every comparable property yourself rather than relying solely on MLS photos.
4. Financing Cost Per Month
Fix-and-flip loan rates in August 2026 range from roughly 9% to 13%, depending on borrower experience, LTV, property type, and lender. The difference between optimized and expensive financing on the same deal can exceed $7,000 over a six-month hold:
| Financing Variable | Optimized | Typical | Expensive |
|---|---|---|---|
| Rate | 9.5% | 11% | 13% |
| Origination | 1.5 points | 2 points | 3 points |
| Loan amount | $250,000 | $250,000 | $250,000 |
| Hold period | 5 months | 5 months | 5 months |
| Total financing cost | $13,646 | $16,458 | $21,042 |
| Difference vs. optimized | , | +$2,812 | +$7,396 |
5. Exit ARV Accuracy
Pull comps that closed within the last 60 days, not 90 or 120. In a shifting market, weight active listings and pending sales more heavily than closed sales. Price reductions on comparable active listings are an early warning signal.
How Fix-and-Flip Loan Structure Affects Your Bottom Line
The financing terms you accept directly determine your net profit. Here's what to evaluate when comparing fix-and-flip lenders:
Leverage: Higher loan-to-cost (LTC) means less cash out of pocket. At 90% LTC with 100% of rehab costs financed, you can control a $157,000 project with under $18,000 in cash. Lower leverage (75-80% LTC) requires substantially more capital and reduces your cash-on-cash return.
Prepayment penalties: A prepayment penalty on a short-term flip loan directly reduces your net profit. If you finish a rehab in four months but carry a six-month prepayment penalty, you're paying interest on two months you don't need. Look for lenders with no prepayment penalty on fix-and-flip loans.
Draw process: Slow draw reimbursements create cash flow gaps that force investors to float contractor payments out of pocket. Virtual draw processes with same-day turnaround keep projects moving and reduce the need for excess reserves.
Close speed: Every day between accepted offer and funded closing is a day your earnest money is at risk and your competition can act. Lenders that close in 5-10 business days give you a significant advantage in competitive markets.
Fix-to-rent option: If the market shifts during your rehab and selling becomes less attractive, the ability to transition your fix-and-flip loan into a DSCR rental loan without starting a new origination process gives you a built-in exit strategy.
Analyze your next deal and get a fix-and-flip rate quote →
The Fix-to-Rent Pivot: When the BRRRR Exit Beats Selling
With margins compressed and days on market extending in many metros, more flippers are refinancing completed projects into DSCR rental loans instead of selling. This is the core of the BRRRR method (Buy, Rehab, Rent, Refinance, Repeat).
The hold-and-rent exit often makes more financial sense when:
- The local rental market supports a DSCR above 1.0 on the completed property
- Days on market exceed 90 days in your ARV price range
- You can refinance into a 30-year DSCR loan at 70-75% of the appraised value, recovering most or all of your invested capital
- Buyer concessions in your market are running 2-3%, which would further erode an already-thin selling margin
LendingOne's Fix to Rent program lets investors transition from a short-term bridge loan into a long-term DSCR rental loan, combining both steps with a single lender. This eliminates the cost and time of a second origination.
For a deeper look at how DSCR loans work and what rates to expect, see our guide to DSCR loans for real estate investors.
Where Fix-and-Flip Deals Still Pencil in 2026
Deals pencil across every price tier when the fundamentals are right. ATTOM's Q3 2025 data showed the highest flipping rates in metros including Atlanta (11.1%), Memphis (10.3%), and Dallas (10.3%), with the highest profit margins in Pittsburgh (103.6%), Buffalo (94.1%), and Memphis (75%).
Markets with strong entry-level and mid-tier flip activity:
- Midwest: Cleveland, Indianapolis, Columbus (OH), Cincinnati, St. Louis, Kansas City
- Southeast: Atlanta (select sub-markets), Memphis, Birmingham, Knoxville, Charlotte
- Mid-Atlantic: Pittsburgh, Buffalo, Scranton (PA)
Markets where higher price point flips remain active:
- Southeast: Tampa, Jacksonville, Nashville, Raleigh-Durham, Charlotte (higher-end sub-markets)
- Southwest: Phoenix (Scottsdale, Gilbert, Chandler), Dallas-Fort Worth, Austin (select pockets)
- West Coast: Las Vegas, Sacramento, parts of Southern California where acquisition-to-ARV ratios still pencil
For a market-by-market breakdown, see our Top 10 Markets for Fix-and-Flippers in 2026 or browse state-by-state investment data.
The key in every market and every price tier: verify that your purchase price stays below 65% of a conservatively estimated ARV based on comps closed within 60 days.
Frequently Asked Questions
What is a good profit margin on a fix-and-flip in 2026?
A gross ROI of 25% or higher is considered solid, though the national average dropped to 23.1% in Q3 2025 per ATTOM. Net ROI (after financing, holding, and selling costs) of 10-15% is a realistic target for a well-underwritten deal. The best margins are in Midwest and Mid-Atlantic markets at lower price points, but experienced investors consistently hit these targets at higher price points through faster execution and tighter acquisition discipline.
How much cash do I need to start flipping houses?
With 90% loan-to-cost financing and 100% of rehab costs covered through a fix-and-flip loan, you may need as little as 10-15% of total project cost in cash, plus reserves. On a $157,000 total project cost, that can be under $18,000. On a $480,000 project, expect roughly $55,000. Most lenders also require three to six months of liquidity reserves.
Should I flip or hold a rental property in 2026?
It depends on the deal and the market. When gross margins drop below 20% and days on market exceed 90, the hold strategy often produces better risk-adjusted returns. The BRRRR method (renovate, rent, then refinance into a DSCR loan) lets you build long-term equity and cash flow. Many experienced investors run both strategies simultaneously, flipping in markets with strong buyer demand and holding in markets with stronger rental yields.
What fix-and-flip loan rates should I expect in August 2026?
Rates range from roughly 9% to 13% depending on borrower experience, LTV, property type, and lender. Origination fees (points) typically run 1-3%. The combination of rate and points matters more than either number alone. More experienced borrowers with a track record of completed projects typically qualify for better pricing. Compare fix-and-flip lenders to understand the full cost structure.
How long does a typical house flip take?
The national average was 161 days in Q3 2025, per ATTOM. This includes acquisition, renovation, and sale. Light cosmetic rehabs in strong markets can complete in 90-120 days. Gut renovations or projects in slower markets may extend to 8-12 months. Experienced flippers working with reliable contractor crews and efficient lender draw processes consistently beat the national average.
What property types qualify for fix-and-flip loans?
Most fix-and-flip lenders finance single-family residences, 2-4 unit properties, condominiums, and townhouses. Properties must be non-owner-occupied (investment properties only). Some lenders also finance mixed-use properties with a residential component.
Run ARV and cash flow analysis on your next flip. Get a fix-and-flip rate quote →
Last updated: August 2026

