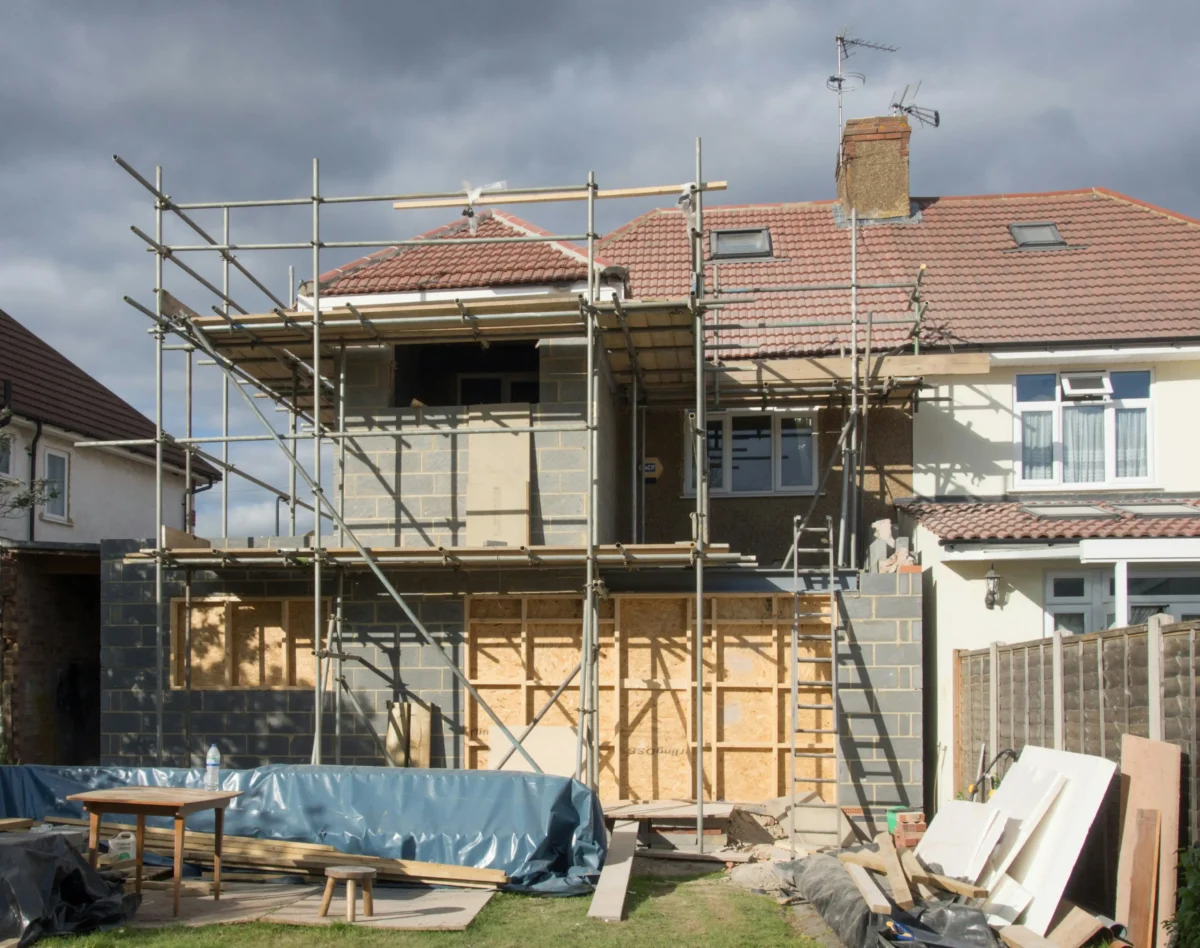
Cash vs. Financing in Real Estate Investing: What’s Smarter?
Paying cash can help you win fast or distressed deals, but it can also concentrate capital in a single asset. Financing adds cost and underwriting, but it can protect liquidity and support stronger long-term growth. The right answer depends on the deal, your exit plan, and how active you need your capital to stay.
If you are buying an investment property, the cash vs financing real estate decision shapes more than your closing timeline. It also shapes your liquidity, risk, return potential, and ability to move on to future opportunities.
For some investors, paying cash simplifies payment and removes financing risk from the deal. For others, financing creates more flexibility by preserving liquidity that can be used in other deals.
The right choice depends on the strategy you use to deploy capital across your portfolio.
To help you make that choice, this article is for investment property buyers, and it uses a simple framework throughout: speed, liquidity, return potential, and scale.
What Paying Cash Really Means in Real Estate
Paying cash isn’t just about avoiding debt. It’s a decision to prioritize certainty over leverage.
A simple way to understand leverage is to compare how the same capital could be deployed. Instead of putting $300,000 cash into one property, you might put $30,000 down and finance the rest. That lets you control the same $300,000 asset while keeping $270,000 available for reserves, renovations, or additional deals.
This approach is most effective in highly competitive markets where speed and certainty determine deal flow. Sellers want a clean, fast close on:
Distressed or off-market properties that need immediate execution.
Short-term holds, where financing costs would eat into the margin.
It can also fit investors who want fewer moving parts and lower financial risk. If your priority is a fast, low-friction close, cash is often the most reliable option.
Benefits of All-Cash Purchases
Paying cash simplifies the transaction and strengthens your position in competitive deals by removing financing-related constraints. With an all-cash approach, you can:
Close faster with fewer conditions or delays.
Strengthen your offer in competitive or distressed scenarios
Avoid interest expense, lender fees, and ongoing debt service.
Reduce complexity by eliminating underwriting and lender requirements.
That simplicity and speed are a major reason investors use cash to secure deals where execution matters most.
Limitations of Using Cash
However, paying with cash comes with trade-offs that can limit long-term growth. You need to account for:
Capital is being tied up in a single asset.
Less flexibility to scale or diversify across multiple properties.
Higher opportunity cost of equity that can’t be used elsewhere.
Less flexibility to maintain reserves for repairs, vacancies, or market shifts.
An all-cash approach works best when speed and certainty outweigh the need for liquidity and portfolio growth.
Is It Better to Use Financing for Real Estate Investing?
For many investors, financing becomes a more effective strategy when the goal shifts from buying a property to building a portfolio.
The core advantage is leverage: You use borrowed capital to control more assets while keeping your own money available for other needs. This is especially relevant for:
Fix and flip properties that need both purchase and rehab capital.
Fix to rent deals that will move into a long-term hold.
Debt-service coverage ratio (DSCR rental), where preserving liquidity and reserves matters.
Financing also lets you stay active across multiple properties instead of tying up all your equity in one.
If your goal is repeatable growth, scaling your real estate investments through financing allows you to keep capital working across several deals at once.
Key Benefits of Financing
Financing does more than reduce upfront cash requirements. It gives you options and flexibility. With the right structure, you can:
Preserve liquidity for additional acquisitions.
Keep reserves available for renovations, vacancies, or market shifts.
Spread capital across multiple properties instead of one.
Use loan proceeds to support both acquisition and rehab on eligible deals.
That flexibility is a major reason investors use financing to grow from one property to several, rather than waiting to save enough cash for each purchase.
Trade-Offs to Consider
Financing is not always frictionless, and it should not be treated that way. You need to account for:
Interest costs and loan fees.
Underwriting requirements and approval timelines.
Sensitivity to rates, terms, and market changes.
Good debt can improve returns, but only when the deal can support it. Financing works best when the loan structure fits the business plan.
Side-by-Side Comparison: Cash vs. Financing
Cash gives you the cleanest path to closing. Financing gives you more room to grow.
The right choice becomes clearer when you compare them through the lens of speed, liquidity, flexibility, and long-term portfolio strategy.
Paying Cash
Financing
Speed to Close
Fastest option with minimal friction
Fast with the right lender, but it involves underwriting
Offer Strength
Highly competitive, especially in tight markets
Competitive when paired with reliable, fast financing
Upfront Capital Required
High, full purchase price
Lower, typically a percentage of purchase and rehab
Liquidity
Capital tied up in one asset
Preserves cash for additional deals or reserves
Return Potential
Stable, but limited by available capital
Higher potential through leverage across multiple deals
Scalability
Limited to available cash
Enables portfolio growth and repeat investments
Risk Profile
Lower financial risk, no debt obligations
Increased risk due to debt, but with higher upside
Flexibility
Less flexible once capital is deployed
More flexible, especially with refinance or exit options
Use Case Fit
Best for quick acquisitions or low-risk strategies
Ideal for scaling, renovations, and long-term investing
Example Strategy
Buy and hold with no debt
Fix and flip or BRRRR using short and long-term financing
A few patterns stand out:
Deal Speed and Competitiveness: Cash wins when certainty is the whole game. Financing can still compete when your lender moves quickly and communicates clearly.
Return on Investment: Cash tends to produce steadier, lower-risk returns. Financing can improve return on equity because you are controlling more assets with less of your own capital.
Risk Profile: Cash removes debt pressure. Financing introduces leverage risk, which is why reserves, deal quality, and exit planning matter.
Scalability: Cash limits your deal volume to what you can buy outright. Financing gives you a path to grow without waiting for each property to pay you back first.
How to Decide If Cash or Financing Is Right for Your Real Estate Investment Strategy
Start with the specifics of the deal rather than a fixed preference for cash or financing. Four questions usually make the answer clearer:
What is your investment horizon? A very short hold may support an all-cash purchase if simplicity matters more than leverage.
How important is liquidity? If tying up cash would slow your next move, financing may be the better fit.
Are you optimizing for speed, returns, or scale? These priorities often lead to different funding decisions.
What is your risk tolerance? Lower debt can reduce pressure, but too much idle equity can also hold your business back.
From there, match your capital strategy to the asset type and execution plan.
Fix and Flip: Often benefits from financing because the project needs speed, leverage, and rehab capital.
Rental Properties: May be a better fit for DSCR rental financing because long-term cash flow matters more than owning it free and clear on day one.
Portfolio Expansion: Once you move into portfolio expansion, financing becomes less optional and more foundational. It is the tool that helps you stay liquid as you add doors.
The Role of the Right Lending Partner
Fast financing only delivers value when the lender understands the investor’s timelines, underwriting requirements, and exit plan. Terms should fit the deal rather than forcing a generic loan onto it.
That is especially important for fix and flip projects, fix to rent transitions, DSCR rental properties, and portfolio financing, where speed and structure both matter.
Can You Use Both Cash and Financing on the Same Deal?
Yes. Many investors use a hybrid approach, such as paying cash to secure a property quickly and then refinancing into a loan to recover capital. This allows you to stay competitive upfront while still benefiting from leverage.
Does Using Financing Always Mean Lower Profits?
Not necessarily. While financing introduces interest costs, it can increase overall returns by allowing you to complete multiple deals at once. The key is to evaluate return on equity, not just total profit for a single property.
How Does Financing Impact Your Ability to Scale a Portfolio?
Financing is often the primary driver of scale. By using leverage, investors can acquire multiple properties rather than tying up all capital in a single deal, thereby accelerating portfolio growth over time.
What Types of Properties Are Easier to Buy With Cash vs. Financing?
Cash is often preferred for distressed or off-market properties that may not qualify for traditional lending. Financing is typically better suited for stabilized assets or projects where lenders can underwrite value and income potential.
How Quickly Can You Close With Financing Compared to Cash?
Cash closes are typically fastest, but modern private lenders can close financing in a matter of days or weeks, depending on the deal. Working with an experienced lender helps minimize delays and stay competitive.
What Happens If Market Conditions Change After You Finance a Deal?
Market shifts can impact rates, values, and exit strategies. Investors using financing should plan for multiple exit options, such as selling or refinancing, and maintain reserves to navigate changing conditions.
Best Hard Money Lenders for Real Estate Investors
The best hard money lenders for real estate investors will offer quick approvals, flexible underwriting criteria, and loan terms tailored to a wide range of investment strategies. Hard money loans can close quickly, but at the cost of higher rates and fees. Therefore, investors should carefully evaluate costs and other financing options before choosing a lending partner.
Hard money lending is a form of short-term financing commonly used by investors who need access to funds quickly. These loans are secured by real estate and rely primarily on a property’s value and investment potential for qualification rather than an investor’s income or credit history.
Hard money lenders for real estate can help investors compete for fix-and-flip properties and other time-sensitive deals. They are especially useful as real estate market trends quickly shift. Traditional financing, by comparison, can be too slow or restrictive when it comes to qualification requirements.
This guide breaks down the best hard money lenders for real estate investing, what to look for, and how those options compare to other financing options. Investors choosing between loan structures may also benefit from reviewing the best loans for an investment property.
Table of Contents
What Are Hard Money Lenders in Real Estate?
Hard money lenders provide short-term loans secured by investment properties. Qualification is based primarily on the property’s value and condition. Lenders also evaluate the strength and profitability of the investment strategy. This is in contrast to traditional lenders, which focus on personal income and credit history.
Hard money loans are designed to be flexible, with funds issued quickly. It’s common for these types of loans to close in days as opposed to weeks. Loan terms typically range between 6 and 24 months, and may also carry interest-only payment options.
Many investors use hard money loans for fix-and-flip investments or to acquire properties quickly in a competitive market. This type of financing can also be used as a bridge loan before transitioning to permanent long-term financing.
Ultimately, the main difference between traditional and hard money financing is the underwriting process and loan terms. Traditional loans may offer more competitive rates. However, hard money loans can often be better suited for investors who need faster approvals and funding.
Best Hard Money Lenders for Real Estate Investors
Data as of May 2026
Lender
Best For
Loan Types
Speed
LendingOne
Best overall; scalable investing and better terms
Fix & flip, DSCR, and portfolio
Fast
Lima One Capital
Rental and fix-and-flip investors
Fix & flip, rental
Moderate-Fast
Kiavi
Tech-enabled investors
Fix & flip, rental
Fast
RCN Capital
Short-term bridge loans
Fix & flip, bridge
Fast
Easy Street Capital
Rental-focused investors
Rental, bridge
Moderate
Anchor Loans
High-leverage deals
Fix & flip
Fast
Lima One Capital
Lima One Capital is a private lender that offers financing for residential real estate investors. Available programs include short- and long-term financing for a range of investment strategies. This includes fix-and-flip, rental property acquisition, and new construction financing. Long-term financing options are also available to complement bridge and rehab loans for transitions from acquisition to stabilization, without switching to a different lender.
Lima One Capital’s lending processes are structured with repeat borrowers in mind. This makes it a good option for investors seeking a consistent financing partner, rather than just occasional projects.
Lima One says it has funded over $10 billion in loans across 46 states.
Best for: Fix-and-flip investors seeking long-term rental portfolio growth
Pros:
Offers short- and long-term financing programs
Structured, predictable processes for repeat borrowers
Loan programs support a wide range of investment strategies
Considerations:
Other lenders may be able to offer more competitive pricing and terms
Complex deals may result in extended closing timelines
Kiavi
Kiavi is a tech-focused lender that uses a platform designed to simplify the loan process. It offers digital applications, quick approvals, and a transparent, standardized underwriting approach. Many investors choose to work with Kiavi because of its speed and efficiency in managing multiple deals simultaneously. Kiavi says 95% of its funded transactions have successful exits.
Kiavi primarily offers fix-and-flip and rental property financing. Plus, repeat borrowers receive benefits, such as faster service and more competitive pricing. However, its loan structures and terms can be less flexible in some cases. Kiavi may not be ideal for more complex deals or deals that fall outside of the lender’s typical parameters.
Best for: Fast tech-driven lending processes
Pros:
Streamlined processes from application to funding
Quick closing timelines for eligible borrowers
Repeat borrowers receive benefits in the form of faster service and lower pricing
Considerations:
Less flexibility in loan terms for complex deals
Specific terms and pricing can vary based on property and borrower qualifications
RCN Capital
Established in 2010, RCN Capital is a private lender with loan programs that focus on short-term, time-sensitive projects. Its offerings include fix-and-flip, bridge, and long-term rental financing. These programs allow investors to acquire properties quickly, complete improvements and repairs, and exit through a sale or refinance to a long-term loan.
RCN Capital’s lending processes are structured around speed and underwriting tailored to each deal for maximum flexibility. The lender works with a wide range of investor profiles, including newer and more seasoned borrowers. Investors will, however, need to have a clearly defined exit strategy, whether it’s selling the property or transitioning to a more permanent long-term loan.
Best for: Investors seeking quick financing for short-term projects
Pros:
Fast closings for time-sensitive transactions
Streamlined lending processes for fix-and-flip and bridge loans
Works with both newer and more seasoned investors
Considerations:
Fewer financing programs for long-term financing
Rates and fees can be higher than alternative financing options
Easy Street Capital
Easy Street Capital is a private lender with programs for rental property acquisition and bridge financing. Its loan programs help investors finance properties through stabilization. After that, borrowers can transition into long-term holds. For this reason, Easy Street Capital is compatible with investors using rental income as an investment strategy, rather than reselling properties.
Easy Street Capital uses Debt Service Coverage Ratio for its underwriting. Properties with a high potential for cash flow will therefore lead to easier approval processes and more beneficial terms.
Best for: Investors seeking financing for long-term rental holds
Pros:
High focus on long-term rental holds
Flexible DSCR underwriting methodology
Offers bridge and long-term financing programs
Considerations:
Fewer options for fix-and-flip investors
Loan terms may be less flexible than those of some other hard money lenders
Anchor Loans
Anchor Loans specializes in fix-and-flip lending programs for experienced investors and high-leverage deals. Its lending platform is centered around offering short-term financing and streamlined draw processes. Investors can use those offerings to move quickly on acquisitions and renovations. It is an attractive option for many investors who are managing multiple transactions simultaneously and need to be able to access capital quickly.
Anchor Loans is also known for its ability to offer higher LTC options compared to many other competitors. This means investors can qualify for funding more easily, since less capital is required up front.
Best for: Fix-and-flip investors managing multiple simultaneous deals
Pros:
Higher LTC options make it easier to qualify for financing
Strong focus on fix-and-flip lending
Fast closing timelines for eligible deals
Considerations:
Less emphasis on long-term rental hold investment strategies
Costs can be higher than those of other long-term or traditional financing programs
Hard Money Loans versus Traditional and DSCR Loans
Choosing between hard money, traditional, and DSCR loans comes down to several key factors: speed, cost, flexibility, and alignment with your investment strategy.
Hard money loans are often preferred for speed and flexibility. They’re possible to close in a matter of days, making them a good option for deals where timing is critical. Rates, however, can be higher, ranging from 10% to 15%, not including loan fees. Hard money loans are designed to be short-term financing. Repayment periods are typically between 6 and 24 months.
Traditional loans from a bank can offer the lowest rates, commonly between 6% and 8%. Loan terms can also be longer, between 10 and 30 years.
The tradeoff is that these loans can be slower to issue approval and funding, require more paperwork and documentation, and carry less flexibility in underwriting. For conforming loans, the 2026 baseline limit for one-unit properties in most of the U.S. is $832,750; high-cost-area limits can be higher.
DSCR loans can be a good middle ground. Rates are typically in the range of 7% to 10% with repayment terms of up to 30 years. While loan amounts vary, DSCR loans are often between $100,000 and $5 million.
These programs also tend to focus on a property’s cash flow in determining loan eligibility, rather than a borrower’s personal income. Investors considering a DSCR loan can review DSCR loans vs. conventional loans to better understand the pros and cons of each.
This is an area where LendingOne stands apart. Its programs can offer investors fast closings just like hard money loans, but with more competitive rates and flexibility when it comes to repayment terms. As a result, investors can build a scalable long-term financing strategy with LendingOne without switching lenders.
Better Alternatives to Hard Money Lenders
Hard money loans are often most useful for short-term financing needs because of their high costs and limited long-term viability. For investors looking to scale across multiple deals, DSCR loans, fix-and-flip financing, and portfolio lending can be better alternatives. Investors can also consider the best states to buy an investment property when planning long-term growth.
DSCR loans are a popular choice for many rental-focused investors. Eligibility for these loans is based on the property’s cash flow rather than personal income. Loan terms of up to 30 years are also common. This helps investors avoid repeated refinancing and short-term debt. This guide to DSCR loans details how these programs work.
For deals where the goal is to add or improve value to a home, fix-and-flip financing can be a better alternative to hard money lending. Fix-and-flip loans can offer better pricing, more predictable draw processes, and loans structured for repeat transactions.
Finally, portfolio rental loans can be considered by investors who have multiple rental properties. Portfolio loans can provide improved efficiency and reduced administrative complexity by consolidating multiple properties under a single loan.
LendingOne allows investors to take advantage of the best of these financing options. The company’s programs allow investors to access funding quickly, just like with hard money financing, but with better rates, terms, and flexibility. The result is a lending partner well-positioned to help with long-term growth.
Upgrade Your Financing Strategy With LendingOne
Hard money loans can help investors move quickly, but at the cost of higher rates and less favorable loan terms. This can become costly beyond the scope of a single deal. Investors looking to grow beyond just a handful of deals will benefit from a more cost-effective solution.
LendingOne offers programs for fix-and-flip projects, long-term rental holds, and portfolio growth. The company focuses on offering flexibility in loan structures, competitive pricing, and transparency throughout the lending process.
LendingOne has been in operation since 2014, with over $8B in funded loans since then.Explore LendingOne loan options to take the next step in your investment strategy. You can also connect with a LendingOne advisor to discuss which program is best suited to your needs.
FAQ: Hard Money Loans for Real Estate
What’s the Difference Between Hard Money and Bridge Loans?
Although each is a form of short-term financing, hard money loans are often used for acquisitions and renovations. Bridge loans are more commonly used to transition between financing strategies, such as moving to long-term financing once repairs to a property have been completed. Bridge loans tend to offer lower costs.
How do I Refinance Out of a Hard Money Loan Into a DSCR Loan?
Once a property has been stabilized and generates rental income, a DSCR loan can be an option. DSCR loans evaluate a property’s cash flow rather than an investor’s personal income.
Do Hard Money Lenders Require Good Credit?
No. Hard money loans focus primarily on the profitability of the deal and the property’s characteristics in determining eligibility and loan terms. However, having good credit can streamline the approval process and allow an investor to secure more favorable terms.
Are Hard Money Loans a Good Idea for Investors?
Hard money loans can be a good option for investors using short-term investment strategies like fix-and-flip deals. Due to their higher rates and fees, they’re not ideal for long-term holds.
What Are Typical Hard Money Loan Rates?
Rates will typically fall between 10% and 15%. Pricing can vary based on the lender’s appetite for risk, the property’s characteristics, and an investor’s track record, financial reserves, and credit.
Key Takeaways
Refinancing investment properties provides access to equity, improves cash flow, and enables portfolio growth through strategies like cash-out, rate-and-term, and portfolio refinancing.
Investment properties require stricter qualifications than primary residences, including at least 25% equity, a credit score in the mid-600s or higher, and under 45% debt-to-income ratio.
A cash-out refinance replaces an existing mortgage with a larger one, with lenders typically capping loan-to-value at 70-75% and requiring 6-12 months of ownership seasoning.
Private lenders offer faster closings and more flexible underwriting focused on property cash flow, making them ideal for investors managing multiple properties or time-sensitive deals.
Avoid common mistakes like overleveraging, underestimating closing costs, and poor market timing to maximize refinancing returns.
Refinancing an investment property looks simple on paper: replace one loan with better terms. In practice, the right move depends on whether you’re after equity, cash flow, or room to grow. Investors have several routes, including a cash-out refinance investment property strategy, each with its own requirements, timeline, and tradeoffs. Knowing which one fits your goals is what separates a refinance that saves money from one that compounds returns.
Why Refinance an Investment Property?
Refinancing is a strategy used by experienced investors to improve profitability, cash flow, liquidity, and leverage. As a result, investors may end up in a stronger position to quickly expand portfolios and acquire additional properties.
Lower interest rates: Lower payments and interest rates typically saves money, which you can put toward maintenance funds and other investments.
Access to equity: With equity from one investment, you can make down payments on other real estate, conduct repairs or improvements, or eliminate high-interest debt.
Better loan terms: Switching between loan structures can give you benefits from each, such as predictable payments for fixed-rate loans and lower interest rates for adjustable loans.
Manageable debt types: You can replace or convert short-term bridge debt into permanent long-term debt for greater financial stability due to more stable payments.
Ultimately, refinancing an investment property is more than just saving on costs. It allows for the conversion of debt to a more favorable structure to support long-term growth.
Refinance Options for Investment Properties
Experienced investors use refinancing as a recurring strategy, rather than a one-time transaction. Several refinancing strategies exist, each with its own set of pros and cons related to cost, return potential, and flexibility.
The most suitable refinancing strategies will depend on your goals: whether it’s accessing equity, improving cash flow, or expanding an existing portfolio.
Cash-Out Refinance
A cash-out refinance allows investors to access a property’s equity and turn it into capital. Common uses include the acquisition of other rental properties, funding of repairs and renovations, or paying off expensive debt.
This is popular with strategies like a BRRRR method, where properties are bought, refurbished (or rehabbed), rented, and refinanced to free up capital for the next deal.
Rate-and-Term Refinance
A rate-and-term refinance enables investors to change the interest rate and/or loan term. By securing a lower interest rate, you can quickly improve a property’s cash flow.
A rate-and-term refinance also allows investors to adjust the length, or amortization period, of the loan and switch between a fixed-rate or adjustable-rate loan.
Portfolio Refinance
A portfolio refinance combines payments on multiple properties into a single loan. This can be beneficial for investors who make separate payments on each property they own or for those considering build-to-rent markets.
Combining payments for properties into a single loan can reduce the time needed to manage finances and simplify servicing issues.
In many cases, it can result in savings due to more favorable investment property refinance rates. This is because it allows investors to leverage the strength of their entire portfolio to qualify for competitive loan rates and terms.
What Is a Cash-Out Refinance on an Investment Property?
A cash-out refinance on an investment property occurs when an investor replaces an existing mortgage loan with a larger one. The difference is then received as cash.
For example, an investor seeking a $300,000 cash-out refinance on a property with an existing $200,000 mortgage would receive $100,000 in cash deposited into their bank account. They would then make payments based on the new terms of the $300,000 mortgage.
The process is similar to refinancing a primary residence. The main differences lie in qualification requirements and loan terms. Cash-out refinances of an investment property carry stricter eligibility criteria. Lenders often require:
Lower loan-to-value (LTV) ratios.
Higher credit scores.
Proof of additional cash reserves.
Loan terms are also typically less competitive. This is partly because investment properties are higher risk, being non-owner-occupied, resulting in a greater likelihood that the owner may default on payments.
A cash-out refinance also differs from a home equity line of credit (HELOC). HELOCs are second liens on the property that provide a revolving line of credit where funds can be drawn over time. A cash-out refinance is a closed-end loan that does not allow for additional draws once the loan has been funded.
How a Cash-Out Refinance Works
A cash-out refinance has four distinct steps that must be completed. Understanding what occurs during each stage can help investors set realistic expectations for the lending process.
Property Appraisal
An appraisal of the property is done to determine its market value and condition. Notably, this is crucial in determining how much equity can be accessed based on the lender’s LTV limits, not the property’s purchase price or estimated value.
LTV Calculation
As a risk-management measure, lenders typically set LTV caps of 70% to 75% for investment properties. LTV can be calculated by dividing the loan amount by the property’s appraised value or sales price (whichever is lower).
Loan Replacement
Once the new loan is approved, funds are sent to the current mortgage to pay it off. The new loan essentially replaces the old loan, and investors will make payments based on the new loan’s interest rate and other loan terms.
Cash Payout
Once the old loan has been paid, the remaining funds are then disbursed directly to the investor. These funds can be used for a range of investment needs, such as acquiring new properties or funding renovations, as long as they adhere to the new loan agreement.
For example, an investor currently owes $200,000 on a property worth $500,000. They submit a loan application with a lender willing to finance up to a 75% LTV. The maximum amount the investor can receive is $375,000.
If approved, the investor would receive $175,000 in cash and make payments on the new $375,000 loan amount.
Requirements to Refinance an Investment Property
Cash-out refinance requirements for investment properties are stricter than those for primary residence refinances. This is because non-owner-occupied properties represent a greater risk of default. However, meeting minimum requirements does not guarantee approval, as lenders evaluate applications holistically.
Core Qualification Requirements
Although lenders have varying standards, the following are common variables investors will be evaluated on:
Credit Score: Common requirements involve a minimum credit score in the mid-600s or higher. This is usually taken as the middle of the three major credit bureaus: Equifax, TransUnion, and Experian. Higher scores often lead to more favorable loan terms.
Loan-to-Value Ratio and Equity: Many lenders cap the LTV at 70-75%. Lower LTVs can lead to more favorable pricing and increase approval odds by strengthening the loan application. For conventional cash-out refinances, many lenders require at least 25% equity to be eligible for financing. Investors with more equity can often qualify for more favorable loan terms.
Debt-to-Income (DTI) Ratio: Lenders calculate DTI to determine an investor’s ability to repay debt. DTI is calculated by dividing monthly debt obligations by an investor’s monthly income. In general, a debt-to-income ratio no greater than 45% is needed.
Property Type and Condition: Single-family properties are the easiest to finance. Multi-unit homes, condominiums, and planned unit developments (PUDs) carry additional layers of risk and can require additional due diligence review by a lender. Regardless of the property type, it must be in good condition and be able to generate stable rental income.
Seasoning Requirements: Many lenders will require an investor to have owned the property for at least 6-12 months before being eligible for a cash-out refinance. Some exceptions may apply, such as if the property was inherited or acquired as part of certain legal proceedings.
What Actually Impacts Approval and Success
Beyond meeting minimum lender requirements, real estate trends and market conditions play a crucial role in loan approvals. For instance, market conditions impact property values and market rents. These are critical factors that lenders take into consideration.
Ultimately, total usable equity plays a key role in determining how much funding an investor can receive. Lenders also evaluate cash reserves and overall portfolio leverage when determining approval, available cash-out, and final loan terms.
Example: Investor A vs. Investor B
To see how loan approvals and terms could play out, let’s consider two investors, one with a strong profile and the other with a weaker profile.
Investor A (Strong Profile):
This investor owes $300,000 on a home worth $500,000 – a 60% LTV. They have an 800 credit score and a two-year history of consistent rental income, with the property located in a stable rental market.
The outcome for this investor is likely:
An easier approval process.
More favorable loan terms.
The ability to get a greater cash-out.
Investor B (Weaker Profile):
Our second investor owes $400,000 on a similar home worth $500,000 – an 80% LTV. They have a 650 credit score, less than 1 year of rental income, and the property is located in a volatile rental market.
The likely outcome for this investor is:
A more difficult approval process, with more paperwork and a longer approval timeline.
A lower cash-out.
Less favorable loan terms.
Cash-Out Refinance vs. DSCR Loans vs. Hard Money Loans
A cash-out refinance is one way to get access to additional capital, but it may not always be the best option. Other refinance structures and loan types may offer access to capital more quickly or at a lower cost.
As an example, below is a quick summary table comparing cash-out refinances to two other common alternatives: DSCR loans and hard money financing.
Factor
Cash-Out Refinance
DSCR Loan
Hard Money
Speed
Slow
Fast
Very Fast
Flexibility
Low
Medium-High
High
Qualification
Strict
Moderate
Flexible
Best For
Equity access
Scaling rentals
Quick deals
Alternatives to Cash-Out Refinancing
A cash-out refinance can be efficient, but it may not always be the best option depending on an investor’s qualifications, needs, preferences, or goals. DSCR, fix-and-flip, and portfolio loans can offer some benefits over a traditional cash-out refinance.
Across these options, flexibility and speed are areas where specialized lenders like LendingOne can support investors more effectively than traditional lenders.
DSCR loans for real estate investors can offer an easier path to qualification as they focus on the property’s ability to generate income, rather than an investor’s personal income. This can reduce income verification paperwork, simplifying the process and expediting approval and funding.
Since qualification is tied to cash flow, DSCR loans are well-suited for investors looking to scale. DSCR loans allow for faster closings and more consistent, repeatable processes across multiple properties.
Fix-and-Flip Loans
Investors commonly use fix-and-flip loans to acquire, renovate, and repair properties before reselling for a higher sales price. These loans can be funded quickly and allow investors to secure deals that may otherwise be lost during the longer timeline of a traditional cash-out refinance.
Portfolio loans, covered above, offer another route for investors holding multiple properties by consolidating that debt into a single loan.
Working With Private Lenders vs. Traditional Banks
In refinancing an investment property, it’s critical to select the right lender. It’s highly recommended to select a lender well-versed in investment property loans.
Traditional lenders may offer more competitive rates and fees. But, they typically come at the cost of slower funding speeds, more extensive documentation requirements, and less flexible underwriting standards.
Private lenders are usually the opposite. They may not have the best rates, but they can offer faster funding speeds and more flexible underwriting requirements, alongside customized loan terms. They also tend to be able to provide tailored repayment terms, loan structures, and a higher level of customer service.
For investors managing multiple properties or working with time-sensitive deals, benefits of private lenders often outweigh the downsides of slightly higher rates and fees.
As a private lender, LendingOne understands the needs of real estate investors. We offer streamlined loan processes, fast funding, and the ability to tailor approvals and terms to align with portfolio goals. Our DSCR rental loan options provide high leverage for both rate/term refinances and cash-out refinances.
Steps to Refinance Your Investment Property
Refinancing can be a complex process, but it can be streamlined if you’re prepared and select the right lender.
Preparing and Submitting Your Application
Even before applying, collecting commonly required documents can streamline the loan approval process. Tax returns, bank statements, financial statements, and lease agreements are some of the documents lenders typically require.
To reduce the likelihood of delays, private lenders can guide investors through this process. This can speed up processes due to their familiarity with the nuances of investment property refinancing.
Locking in Your Rate
Interest rates can fluctuate daily. Locking in a rate guarantees you’ll receive that rate. Although, this depends on your application’s approval and whether you comply with the lender’s requests for documentation in a timely manner.
Lenders have varying policies regarding how rate locks are handled. Some allow rates to be locked in only upon full approval of your loan application.
Others may offer a lower rate for a fee, should rates lower significantly during the course of your application process. Private lenders, in general, offer more flexibility in terms of rate lock.
LendingOne offers a complimentary 45-day rate lock that allows investors to lock in rates now to protect against market changes later.
Undergoing Underwriting
Underwriting is the process by which lenders evaluate your entire application to ensure adherence to lending guidelines.
In this process, an investor’s finances, credit, and the property’s value and condition are all reviewed. This is so the lender can determine if the loan can be approved and if there are specific loan terms available.
Private lenders often place a larger emphasis on a property’s cash flow, rather than personal finances and income. This can make it easier to get approved compared to traditional lenders.
Closing the Loan
Once your loan has been approved, you’ll be able to schedule an appointment to sign the final paperwork. This often involves a notary public to verify your identity, so be sure to pay attention to instructions on acceptable forms of identification.
Once signed, the paperwork will be reviewed once more by your lender, at which point funds will be disbursed. Private lenders often maintain excellent communication during each of these stages to ensure a smooth close.
Timing, Costs, and Maximizing Your Refinance Returns
Investors should consider whether it’s the right time to complete a refinance. Interest rate trends, property values, and rental demand are all factors that can impact its effectiveness.
For instance, the property’s current market value can impact how much equity you may be able to access. And, loan costs such as origination fees and third-party costs can cut into expected profits.
Investors should also consider the exit strategy they’ll use to identify the most suitable refinancing strategy. Some strategies include holding a property for long-term rental income, upgrading the home for a sale, or reinvesting funds via a 1031 exchange.
Timing, loan terms, and the reinvestment strategy are variables investors should consider in maximizing returns when refinancing an investment property. Timing refinances when rates are low or after a property has appreciated can result in greater cash flow and access to funding.
Adjusting loan terms can also help reduce payments if the amortization period is extended. Or, it can reduce the total amount of interest expenses paid if it’s shortened.
Common Mistakes to Avoid
Refinancing alone can be risky. Investors need to put a lot of effort into investigating market shifts and rate changes. Therefore, when refinancing, you’ll want to avoid making the following mistakes:
Overleveraging involves taking on too much debt at the cost of reducing the amount of available cash. This can be dangerous if markets shift.
Underestimating closing costs can reduce expected profits or cash flow. It’s important to consider all fees, including origination costs, appraisal expenses, prepayment penalties, and other third-party vendor charges.
Mistiming the market, like refinancing before rates rise or property values fall, can eliminate or reduce expected benefits from refinancing.
How LendingOne Helps Investors Refinance Investment Properties
Refinancing investment properties can be a strategic move. It can improve your cash flow, provide access to more capital, and offer a greater ability to grow your portfolio. With the right lending partner, investors can use refinancing as a financial tool to ensure scalable long-term growth.
LendingOne helps investors access equity through financing solutions designed specifically for investing. Rather than taking a one-size-fits-all approach, LendingOne can help evaluate the best way to access equity based on your investment strategy.
Explore loan options to evaluate which financing structure aligns with your goals.
LendingOne’s team knows that time is of the essence for all real estate transactions. As such, the company provides streamlined processes to eliminate delays by emphasizing consistency, repeatability, and predictability through each stage of the loan process.
LendingOne also provides a wide range of financing options – including DSCR loans, fix-and-flip financing, and portfolio lending.
Yes. Investors regularly refinance investment properties to lower payments, access equity, or change loan terms. Issuing loans on investment properties represents a higher risk to lenders, so eligibility criteria are generally far stricter compared to owner-occupied primary residences, with lenders often requiring lower loan-to-value ratios, higher credit scores, and proof of additional cash reserves.
Are There Tax Implications With a Cash-Out Refinance on an Investment Property?
Cash received from a cash-out refinance is generally not considered taxable income because it is borrowed money. However, refinancing can affect interest deductions and broader tax planning, so investors should always consult a qualified tax professional.
How Long Does a Cash-Out Refinance on an Investment Property Typically Take?
A cash-out refinance on an investment property often takes 30 to 45 days, though timelines vary by lender, appraisal scheduling, underwriting complexity, and document readiness. Investment property refinances may take longer than primary residence refinances because requirements are usually stricter.
What Is the Seasoning Requirement for a Cash-Out Refinance on an Investment Property?
Most lenders require an investor to have owned an investment property for 6-12 months before being eligible to complete a cash-out refinance. Some exceptions may apply, such as when the property was acquired through an inheritance or other legal proceedings.
Can I Use a Cash-Out Refinance to Buy Another Investment Property?
Yes, unless specifically prohibited by the terms of the new cash-out loan, investors are generally free to use the funds for a variety of purposes, including purchasing a new property or funding renovations.
Investment Property Loan Requirements for Real Estate Investors
Understanding investment property loan requirements is key for investors looking to acquire or refinance properties. Investor financing differs from traditional mortgages because lenders focus on property performance rather than personal income. Cash flow, liquidity, and project complexity are therefore key pillars that determine an investor’s eligibility for financing. Understanding these factors can help investors secure financing more efficiently and also structure stronger deals.
Key Takeaways
Investment loans are issued based on the property’s performance, characteristics, and investment strategy, rather than an investor’s personal income.
Key eligibility criteria include DSCR, LTV, LTC, ARV, liquidity, and investor experience.
Requirements vary by loan type, property characteristics, and lender guidelines. An investor’s level of experience can also impact the final rates and terms issued by a lender; terms become more favorable as an investor builds their track record.
Common Investment Property Loans Qualification Standards
While specific criteria can vary across lenders, many investment property loan programs evaluate similar factors: property performance, investor experience, and amount of leverage.
Non-Owner Occupied Classification
Investment property loans are designed solely for non-owner-occupied properties for business purposes, and do not qualify if an owner lives at the property. As a result, lenders evaluate various aspects of the deal, such as cash flow potential and market demand.
Since non-owner-occupied properties represent a greater risk of financial loss to the lender in the event of a default, qualification requirements tend to be focused more on the property’s potential to generate income in the long term.
Business-Purpose Lending
Investor loans often originate under an LLC, corporation, or other business entity. These loans rarely originate in an investor’s personal name.
Borrowing through an entity offers investors certain legal protections; it separates personal finances from business debt. This approach allows lenders to evaluate the property itself, rather than the personal income of an investor. And because underwriting is primarily based on the property and the deal, many programs do not require W-2s or tax returns.
Risk Profile Differences
Because investment properties are underwritten as non-owner-occupied, lenders often treat them as higher-risk than primary residences. They’re more likely than owner-occupied homes to result in payment defaults.
The added risk impacts how lenders price and structure available loan programs, with limits imposed on loan-to-value (LTV), loan-to-cost (LTC), and debt-service coverage ratio (DSCR). Strong cash flow and financial ratios can improve leverage and secure more favorable pricing from lenders.
Why Lenders Structure Guidelines Around Investment Performance
Many investment loan programs weigh the property’s debt-service coverage ratio more heavily than personal income, especially for rental-focused products.
For those reasons, metrics such as DSCR, after-repair-value (ARV), exit strategy, and comparable properties are of greater significance to a lender. Short-term loans often have a focus on timeline and project viability, whereas long-term loans have a greater emphasis on stable cash flow.
The 5 Core Qualification Factors
Most investment loan requirements can fit into five key areas that are analyzed by lenders for purposes of determining eligibility.
Property cash flow or projected value
In evaluating rental properties, lenders will determine whether projected income will support the property’s debt payments. For this reason, lenders commonly review market rents and DSCR ratios.
Properties in need of renovations will have a focus shifted to ARV, with comparable homes being evaluated to determine the likely value after repairs have been completed. Overestimating ARV can quickly result in a loan denial, with conservative estimates leading to more leverage and improved approval odds.
Loan-to-value or loan-to-cost ratios
A property’s LTV measures the loan amount in comparison to the value of the real estate. LTC compares the loan to the total cost of the property, with renovation and construction costs included. Higher leverage increases lender risk, so investors should verify program leverage limits early and estimate cash-to-close before they apply.
Investor experience
Investors with a long track record of success represent a lower risk to lenders. This can come in the form of a completed flip, rental ownership history, or experience in managing multiple properties. Lenders can consider this because it indicates an investor’s ability to execute the business plan and coordinate the tasks necessary to see a project through to completion. Typically, as an investor grows their track record they will receive more favorable terms from lenders.
Credit profile
Although investment loan programs are more focused on the property itself, credit still plays a key role in the underwriting process. Most lenders have a hard minimum credit score required to receive a loan. Investors with clean credit typically receive more favorable rates and terms because it signals an ability to manage finances responsibly and repay debt on time. A credit history with late payments or other derogatory marks may not prevent approval, but it can lead to a more costly loan.
Liquidity and reserves
Liquidity shows an investor’s ability to handle required as well as unexpected costs. Lenders will often verify which funds are for the down payment, closing costs, and any financial reserves that they may require as a condition of loan approval. Investors with strong liquidity can show lenders they have the ability to weather market shifts, which lowers perceived risk, and can streamline underwriting approval.
Requirements by Loan Type
Qualification requirements can vary among lenders based on the loan program and investment strategy. For a more detailed discussion, see our guide to types of loans for investment properties.
DSCR Rental Loan Requirements for Rental Properties
DSCR rental loans qualify a property based on its cash flow, rather than an investor’s personal or business income. Common minimum requirements include a DSCR of 0.75x and an 80% LTV for purchases. A 0.75x DSCR means the property is projected to generate 75% of the income needed to cover its debt payments. Eligible property types typically include single-family homes, townhomes, condominiums, and 2-4 unit properties.
Fix and flip loans focus on ARV and the ability to execute on strategy and see the project through to completion. Many require prior experience in the form of at least 1 completed project in the last 36 months. Allowable ratios can often be up to a 92.5% LTC or 75% ARV — often structured as 12-month loans with interest-only payments. Income verification is rarely needed.
Fix to rent loans are ideal for investors adopting a BRRRR-style business strategy by combining rehab financing into a long-term rental loan. Investors can usually finance up to 95% in costs for an interest-only period of up to 12 months. Once the repairs and construction are complete, some lenders may offer discounts for staying with the same company and converting the loan into long-term financing.
New Construction Loan Requirements
New construction loans are often for ground-up projects. Many lenders offering these loans require at least one completed ground-up build in the past 36 months. Eligibility usually allows for up to 90% LTC and up to 70% ARV, depending on the details and complexity of the project.
Payments are usually interest-only during the construction stage, and required paperwork almost always includes a build timeline and a detailed construction budget.
SFR Portfolio Loan Requirements
Financing multiple properties with a single loan can be possible with an SFR portfolio loan. A minimum of 3 properties is usually required, with a combined portfolio DSCR of at least 1.0. Allowable ratios typically reach 80% LTV for purchases and 75% for refinances. Investors can expect financing to be available between $500,000 and $3 million.
Documentation Checklist
Having the required paperwork ready can expedite your loan approval and access to funding. Documentation by loan type varies, but commonly requested items include:
Schedule of real estate owned.
Government-issued photo identification.
Title agent information.
Authorization for a credit check, if required by the lender.
Applicable purchase agreement for the property.
Projects with renovation or rehab costs should also have a construction budget.
Be prepared to make any payments necessary for the loan application or third-party expenses, like an appraisal.
Common Mistakes That Delay Approval
Mistakes can delay underwriting approval and push back your funding timeline. Common issues include:
Overestimating ARV and market rents.
Ignoring DSCR calculations.
Applying under the wrong loan type.
Incomplete or inaccurate construction budgets.
Waiting too long to engage a lender.
In addition to delaying funds, these mistakes can reduce available leverage or change loan terms. Investors should seek financing as early as possible, so any potential issues can be identified and resolved.
Quick Self-Assessment Questions
Although you won’t know the final terms until underwriting is complete, a quick self-check can help you spot issues early. Investors should:
Verify whether the property is eligible as a strictly non-owner-occupied home.
Check LTV and LTC limits.
Verify estimates for market rent in relation to debt payments.
Evaluate whether you meet a lender’s experience and credit score requirements.
Identifying issues before applying for a loan can save time and money later on in the process.
Get Pre-Qualified for Your Investment Property Loan
Understanding investment property loan requirements is just one of many steps. Some requirements vary by loan type and property details, so the fastest next step is to verify whether your deal fits within the lender’s parameters. Getting pre-qualified for a loan is a quick and easy way to get this answer.
Working with a direct lender, like LendingOne, can reduce back-and-forth during underwriting. Start your investment property loan application today, or speak with a LendingOne loan advisor to confirm eligibility and next steps for your deal.
FAQs About Investment Property Loan Requirements
How long does it take to get approved for an investment property loan?
It can take between 14 and 30 days to get approved. Approval speed depends on the loan type and complexity, as well as how quickly you provide the requested paperwork. Due to the variability of the timeline, investors should engage a lender as early as possible.
Will the lender verify my rent projections?
Yes. A lender’s appraisal report typically evaluates comparable homes to validate rent projections. Conservative rent projections can lead to a smoother underwriting experience as there’s a greater likelihood that the appraisal will support the initial projections.
Can I refinance an investment property shortly after purchase?
Yes. Many lenders offering investment loan programs understand that investors often use a short-term loan to fund repairs and renovations, then refinance it into a more permanent, long-term loan.
What can cause a lender to decline an investment property loan?
Lenders often decline loans if their evaluation of the property does not match the initial projections that the investor provided. For this reason, investors should use realistic rent projections and ARV numbers.
What credit score do I need for an investment property loan?
Credit score requirements vary by lender, loan type, and investment strategy. While investment property loans are primarily based on the property and deal structure, lenders still use credit history to evaluate risk. A stronger credit profile may help investors qualify for better rates, terms, and leverage.
How much money do I need for a down payment on an investment property loan?
Down payment requirements depend on the loan program, property type, and deal details. Investors should expect to bring funds for the down payment, closing costs, and any required reserves. For loans with renovation or construction costs, lenders may also review the project budget to confirm the investor has enough liquidity to complete the plan.
Inside the April Housing Data: More Inventory, Same Hesitation
April gave investors more inventory, slightly better affordability, and another reminder that the housing market is still not breaking open.
Existing-home sales rose just 0.2%, missing expectations. Mortgage rates moved lower for part of the month before reversing higher again. Builder sentiment fell to its weakest level since last fall.
Inventory is building fastest in the markets where pricing pressure is most visible. The West continues to soften while the Midwest and Northeast remain resilient. Single-family rents are still outperforming multifamily. And builders pulling back now likely means tighter resale supply later.
For investors, April was not a “housing is back” report. It was a market-selection report.
Existing-Home Sales: Demand Is Still Rate Sensitive
Existing-home sales increased 0.2% month over month in April to a seasonally adjusted annual rate of 4.02 million, flat year over year. Economists had expected a stronger rebound following March’s decline, but buyers remained highly rate sensitive.
Regionally, the Midwest and South posted modest monthly gains, while the West declined and the Northeast was flat. Median days on market fell to 32 days from 41 in March, though still above the 29-day pace from a year ago.
What it means for investors
Low transaction volume continues to create a market with less competition, less pricing clarity, and more negotiation leverage for buyers with capital ready to deploy.
The broad bidding-war environment of 2021 and 2022 is gone. In many markets, motivated sellers are negotiating again.
Home Prices: National Stability, Regional Divergence
The national median existing-home price rose to $417,700 in April, up 0.9% year over year and marking the highest April median price on record.
But the regional divergence continues widening. The Northeast posted 4.8% annual appreciation, while the Midwest gained 3.6%. The South was nearly flat at 0.4% growth, and the West declined 1.4% year over year.
At the same time, affordability is gradually improving. The Housing Affordability Index increased to 110.6 from 101.4 a year ago as wage growth continues to outpace national home-price growth.
What it means for investors
The national market is no longer moving in one direction.
In the Northeast and Midwest, constrained inventory continues supporting appreciation and long-term equity growth. In parts of the West and Sun Belt, inventory normalization is creating better entry pricing and reducing reliance on future appreciation to make deals pencil.
Both environments can work. The key is understanding which market you are actually underwriting.
Inventory: The Most Important Number in April
Housing inventory rose to 1.47 million units in April, up 5.8% month over month and representing a 4.4-month supply.
That remains below pre-pandemic norms nationally, but the aggregate number masks meaningful regional resets already underway.
Parts of Florida, Texas, Arizona, Colorado, and the Mountain West are seeing supply levels normalize much faster than the rest of the country. Those are also the same markets where pricing pressure has become most visible.
What it means for investors
More inventory matters because it changes investor behavior.
Deals become less dependent on aggressive appreciation assumptions. Buyers gain leverage. Underwriting becomes more disciplined. And acquisition opportunities improve in markets where supply has reset furthest.
Nationally, inventory still remains historically constrained enough to support long-term pricing.
Mortgage Rates: Buyers Are Waiting for Openings
Mortgage rates moved lower through much of April before reversing late in the month. Freddie Mac’s 30-year fixed rate fell near 6.3% in April before moving back higher into early May.
The response from buyers was immediate. Purchase applications moved above year-ago levels during the brief rate dip as affordability and inventory both improved modestly.
What it means for investors
The buyer is still there. April reinforced that housing demand has not disappeared. It is simply highly rate sensitive.
For investors holding single-family rental assets, that demand profile remains supportive of long-term exit demand. For buyers acquiring today, it reinforces the importance of underwriting conservatively at current borrowing costs rather than depending on future refinancing assumptions.
Rents: Single-Family Continues to Outperform
Zillow forecasts single-family rents to grow roughly 2% year over year through 2026, while multifamily rent growth is expected to remain closer to 1% as apartment supply continues working through the market.
The dynamic is straightforward as many households still cannot afford to buy, but apartment supply in several markets expanded too aggressively during the last construction cycle.
Single-family rental inventory did not experience that same level of overbuilding.
What it means for investors
SFR rent growth is not explosive, but it remains durable.
Compared to multifamily, single-family rentals continue benefiting from tighter supply conditions and sustained demand from households staying in the rental market longer.
New Construction: Builders Are Pulling Back
Builder confidence fell to 34 in April, the lowest level since September 2025. Current sales conditions weakened, buyer traffic declined, and future sales expectations fell sharply.
At the same time, 36% of builders reported cutting prices, while 60% continued offering incentives such as rate buydowns and concessions.
What it means for investors
Builder caution today likely translates into tighter resale supply several years from now.
In the near term, incentives and pricing pressure are creating selective opportunities in new construction markets that were largely unavailable during the peak frenzy years.
Longer term, reduced construction activity supports the broader housing supply imbalance that continues underpinning residential real estate.
The Big Picture
April did not deliver a breakout housing-market recovery.
What it delivered was more evidence that the market is slowly moving toward better balance, but unevenly.
Inventory is improving. Affordability is stabilizing. Buyer demand remains reactive whenever rates ease. But transaction volume is still historically subdued, builders are becoming more cautious, and regional divergence is widening.
For investors, that environment still creates opportunity. The easy appreciation trade is gone. What remains are specific markets where supply has reset, rent demand remains durable, and disciplined underwriting matters again.
Bridge Loan vs. Hard Money: Which Is Better for You?
Choosing between bridge loan vs. hard money financing directly affects deal speed, cost, and long-term portfolio growth.
Although both are short-term loans, each serves a different strategy for investors, with key differences in closing timelines, costs, and loan terms. The right choice depends on your timeline, risk tolerance, and exit plan.
Comparing the pros and cons of bridge loans vs. hard money financing will help you choose the option that best aligns with your investment strategy. It also provides important context for how each compares to other types of loans for an investment property.
Key Takeaways
Bridge and hard money loans are both short-term, asset-based financing options, but they support different investment strategies.
Bridge loans are ideal for investors planning to retain the property long-term.
Hard money loans are often the better choice for time-sensitive deals or highly distressed properties.
What Is a Bridge Loan?
A bridge loan is temporary, short-term financing designed to bridge the timing gap between two transactions. “Bridge loan” is a generic umbrella term, as there are many different types of bridge loans depending on the details of the underlying asset, borrower profile, and investment strategy.
Bridge loans typically fund the initial acquisition or repair of a property, which is then refinanced and paid off with a more permanent financing program. They’re often used to:
Stabilize rental properties for transitioning into a debt-service coverage ratio (DSCR) loan.
Acquire real estate that does not meet the lending requirements of conventional financing programs.
Most bridge loans have terms between 6 and 24 months, requiring interest-only payments, with underwriting focused on the property’s value and the investor’s exit strategy.
Pros & Cons of Bridge Loans
The pros of bridge loans are in their flexibility and efficiency, but they need a clearly defined execution strategy and exit plan to mitigate risk:
Pros
Structured yet flexible approach to financing, with interest-only payments, helps reduce strain on cash flow.
Approval based on property value and income potential versus personal income, meaning it can be easier to secure approval for qualifying deals.
Cons
Requires a clearly documented and realistic exit plan, which may require more documentation than other financing options.
Short-term maturity increases pressure to execute and repay on time, making them more suited for experienced investors or lower-risk projects.
What Is a Hard Money Loan?
A hard money loan is an asset-based loan, often offered by private companies rather than traditional banks. These loans are ideal when speed is a priority or when a property’s condition renders it ineligible for traditional financing.
Many investors use hard money loans for:
Fix-and-flip properties.
Auction purchases.
The acquisition of real estate in need of significant repairs and renovations.
Hard money loans usually have loan terms between 6 and 12 months, with approvals based primarily on the property’s after-repair value (ARV) and overall viability. Lenders want to see how the property will perform after repairs.
Pros and Cons of Hard Money Loans
Compared to bridge loans, fees and rates for hard money loans tend to be higher. The tradeoff, however, is expedited approval and funding speeds.
Pros
Can be approved and funded faster than many other types of financing, making them suited for time-sensitive projects.
Easier to secure approval, even on distressed property, since approval is based on property characteristics and projected performance.
Cons
Tend to be more expensive, with rates and fees higher than those of bridge loans.
Less margin for delays in completing the investment strategy due to shorter repayment terms.
Bridge Loan vs. Hard Money at a Glance
Both bridge and hard money loans are short-term, asset-based, but they differ in overall costs, loan terms, and underwriting flexibility.
Bridge loan
Hard money loan
Term length
Typically 6-24 months
Typically 6-12 months
Typical rates
Often in the high single digits to low teens, depending on leverage, property type, and borrower experience
Often in the low to mid-teens, with higher variability based on deal risk
Typical points/fees
Commonly 1-3 origination points
Commonly 2-5 origination points
Leverage
Often structured around LTC or stabilized value; can be competitive for experienced investors
Commonly based on LTC and ARV, with flexibility for distressed properties
Speed
Fast closings, often 10-21 business days with private lenders
Very fast closings, sometimes under 10 business days
Fix and flip projects, distressed assets, and auction purchases
Exit strategy
Refinance into a long-term rental loan or sell after stabilization
Typically sell after renovation, occasionally refinance
LendingOne’s bridge loan programs can close in as few as 5–10 business days with rates depending on deal specifics.
How rates and fees compare
Rates and fees vary by leverage, property type, borrower experience, and deal risk. Bridge loans often fall in the high single digits to low teens, with origination fees commonly around 1 to 3 points. Hard money loans are usually priced higher, often in the low to mid-teens, with fees more commonly around 2 to 5 points. For investors, the full cost of capital matters more than the rate alone. Points, extension fees, and prepayment terms can all affect returns.
Cost Structure
Hard money loans tend to be more expensive, carrying higher rates and fees. Bridge loans can be more competitive on pricing, which is where the savings can add up, especially for high-volume investors.
Underwriting Approach
Hard money loans can be easier to get approval for, as they place a large emphasis on ARV and cash flow of the property. Bridge loans, while still focused on property performance, often require clearer exit strategies and a supporting business plan. However, understanding the things to look for in a bridge lender can help investors get through the lending process more easily.
Loan Size and Leverage
Hard money and bridge loans are typically structured around loan to cost (LTC) or ARV figures.
Bridge lenders, however, tend to offer greater loan amounts, making them generally more suitable for investors managing multiple projects at once, as well as those who plan on building a larger portfolio over time.
Speed to Close
Hard money loans are known for closing quickly. In many cases, loans can close in as little as 10 business days. Bridge lenders generally take an additional 7-10 days on average, although many private lenders, including LendingOne, can match the funding speed of a hard money loan, depending on the transaction details.
Intended Exit
Reselling the property is the most common exit strategy of a hard money loan. Many investors renovate the property and then sell it within a short period of time. Bridge loans are more suitable for investors planning on retaining the property once the property has been stabilized, with a refinance into a long-term loan as the most common exit strategy.
When a Bridge Loan Is the Better Fit
The terms offered on a bridge loan are often more suitable for investors who plan on retaining the property long-term. A typical use case is to use the loan proceeds to acquire and repair the property so that it can be eligible to be refinanced into traditional long-term financing. Fix-to-rent is a common investment strategy where a bridge loan performs well, as it supports the full cycle of acquisition, repairs, and transition into a DSCR loan.
When a Hard Money Loan May Make Sense
A hard money loan could be the better choice for deals where timing is critical or the property needs significant renovation before resale. Common examples include:
Fix and flip projects with a short hold timeline
Auction deals with fast closing requirements
Competitive bidding situations against other investors
Extremely distressed properties that may not qualify for more traditional financing
Because hard money loans are often structured around ARV and project viability, they can be a practical fit for investors who plan to renovate and sell the property quickly.
How LendingOne Structures Bridge Loans
LendingOne’s bridge loans are tailored to the way investors execute deals. As a direct lender, LendingOne focuses on speed, flexibility, and consistency in the financing process. All of these facilitate repeat transactions for investors managing a large portfolio.
LendingOne’s fix-and-flip loans can support projects up to a 92.5% LTC, with 100% funding for rehab costs. Interest-only payments reduce cash flow pressures, and there are no prepayment penalties, so investors can exit the loan at any time without incurring additional fees.
Fix-to-rent loans are geared towards a buy, rehab, rent, refinance and repeat (BRRRR) strategy. They provide investors with a streamlined process to transition from the renovation stage to DSCR financing.
LendingOne structures its programs to support repeat investors with consistency and speed across multiple projects.
Ready to close your next deal? See your rate with a LendingOne product with no commitment required.
FAQs About Choosing Between Bridge & Hard Money Loan
Which is cheaper?
Bridge loans tend to cost less, with lower rates and fees. However, pricing varies based on leverage, property type, borrower experience, and deal risk. Comparing total cost, including points and fees, is the most reliable way to evaluate options.
Is a bridge loan considered hard money?
Not exactly. Both are short-term, asset-based loans, but they differ in structure and use case. Bridge loans are often more structured and commonly used for refinance strategies, while hard money loans are typically used for faster, higher-risk projects like fix and flip investments.
Can you use a bridge loan for fix and flip?
In some cases, yes. While fix and flip projects are more commonly financed with hard money, certain bridge loan programs can support renovation and resale strategies, especially when the project has a clear exit plan and a moderate scope of work.
Can I refinance a hard money loan into a rental loan?
Yes. Many hard money loans are issued with the expectation that they will be replaced with another type of loan. Investors often refinance into long-term rental financing, such as a DSCR loan, after completing renovations and stabilizing the property.
Can you refinance a bridge loan into a DSCR loan?
Yes. This is one of the most common bridge loan exit strategies. Investors use bridge financing to acquire and stabilize a property, then refinance into a DSCR loan once the property is generating consistent rental income.
Are bridge loans easier to qualify for than conventional loans?
In many cases, yes. Bridge loans place more emphasis on the property’s value and income potential rather than personal income. This can make them more accessible for investors who may not meet traditional lending requirements, especially for value-add properties.
Do I need income verification?
Personal income verification is often limited or not required. Both bridge and hard money loans focus more on the property’s characteristics, such as projected cash flow and after-repair value.
How fast can I close?
Hard money loans can close in as little as 10 business days. Bridge loans typically close in 10 to 21 business days, depending on deal complexity and how quickly documentation is provided.
How to Scale Your Fix and Flip Portfolio
After completing their first few projects, investors often face the next challenge: scaling a fix and flip portfolio. Scaling while maintaining operational oversight and managing risk can be especially difficult. Building a consistent pipeline requires more than just sourcing additional deals on an individual basis. Investors who can do so successfully typically have consistent, reliable, and repeatable processes that allow for quick execution and efficient use of capital.
Key Takeaways
Scaling a fix and flip portfolio requires more than just acquiring more deals. Investors must make efficient use of capital and implement systems that support consistent acquisitions, rehabs, and exits.
A defined buy box cuts deal evaluation time and eliminates properties that don’t fit your margins before due diligence begins.
Investors who can recycle capital efficiently can redeploy those funds to acquire and rehab more properties in a shorter period of time.
Scaling Is About Systems, Not Just More Deals
Investors often assume that finding more properties to flip is key to scaling a portfolio. Focusing on improving processes can help investors move from occasional deals to a consistent pipeline that delivers greater return on investment (ROI) per deal.
To start improving processes, investors should ensure that each step of an investment deal is done consistently and efficiently. This can include tasks such as managing acquisitions, renovations, and financing. Without this, uncertainty and inconsistency are introduced into each project’s timeline, which can lead to extended timeframes and added costs.
Three key characteristics of a scalable business are systems, capital efficiency, and disciplined exits. Systems must allow for consistency in how every stage of a project is handled. At the same time, capital efficiency should allow investors to fund new and existing projects to make the most of available capital. Finally, disciplined exits allow investors to ensure adequate margins.
Build Infrastructure That Supports Multiple Projects
A scalable fix and flip portfolio must have consistent and repeatable processes in place that allow each project to move forward simultaneously. This ensures that no single project requires constant oversight. The result is more predictable costs, timelines, and outcomes.
Define and Standardize Your Buy Box
A clear buy box outlines the property characteristics that must be met to fit your business structure and investment model. This allows investors to save time and easily identify compatible projects.
Common elements of a buy box include:
Property type: Examples can include single-family homes, condos, townhomes, and multifamily properties.
Target ARV (after repair value) range: A resale price aligned with buyer demand.
Minimum profit margin thresholds: Specific ROI figures to be identified based on projected costs.
Renovation scope boundaries: Distinguish between minor versus more involved and costly renovations.
For example, one investor may focus exclusively on single-family homes with an ARV between $250,000 and $400,000, targeting acquisitions at or below 70% of ARV, with light-to-moderate renovation needs and a minimum projected profit margin of 15%.
Create Repeatable Renovation Systems
Renovations are where timelines and margins are at the greatest risk. Having a standardized workflow for managing this stage can reduce delays and keep your projects on budget. Effective ways to achieve this include:
Standardized scopes of work: This is especially helpful for property types you commonly encounter.
Pre-approved material packages: Consider common materials for the projects you work on, such as kitchens, paint, and fixtures. Some investors also buy materials in bulk for use across multiple projects.
Contractor benchmarks: Establish acceptable thresholds for pricing and performance metrics.
Clear timeline targets: Define clear expectations for each stage of the renovation.
Protect and Recycle Capital Efficiently
Investors often view limited deal flow as the main barrier to growth. However, capital efficiency is often what determines whether scaling is possible, as it ensures funding can be deployed to other projects, rather than being tied up in a single investment.
Use Leverage Strategically
Strategic leverage allows a single pool of capital to finance multiple projects simultaneously, which is especially helpful when capital or access to funding is limited.
As an example, fix and flip loans often allow up to a 92.5% loan-to-cost (LTC) ratio with 100% of the rehab costs financed. Interest-only payments also reduce strain on cash flow, while the lack of any prepayment penalties allows for quick exits without incurring additional costs.
Investors new to these financing structures should understand how fix and flip loans work and what investors should know when reviewing underwriting.
Shorten Hold Times to Increase Velocity
The faster capital moves through each project stage, the more opportunities investors can pursue. Several key aspects can help with this process:
Faster closings give investors a greater ability to secure and win bids.
Clear draw schedules, such as a lender with milestone-based draws and 24–48 hour disbursements, help keep renovations on schedule.
Defined exit timelines should outline what to expect given local market conditions.
Ultimately, reducing hold times and capital drag allows investors to shorten project cycles to maximize the number of deals that can be completed, without increasing access to capital.
Expand Volume Gradually to Control Risk
Structuring your business to go from one project at a time to multiple can introduce operational complexities. Investors should take a measured approach to growth; going too quickly can place unnecessary strain on finances and operational logistics.
Consider moving from one project to two before attempting more. This slower transition can reveal processes that need improvement, such as financing and exit timelines. Investors may also find that contractor capacity can be a limiting factor, with less reliable teams being the main cause of delays and budgeting issues.
Investors should have a grasp on liquidity management. Adequate reserves allow investors to better handle market shifts and cover unexpected costs, such as repairs and extended exit timelines.
Investors who scale slowly can better position themselves to manage uncertainty and market risks. Those who expand too aggressively may find that more deals experience delays and lower margins.
Strengthen Exit Strategy Before You Scale
Having a clear exit strategy ensures safe scalability. As volume increases, minor oversights and errors can compound quickly over multiple properties. With that in mind, a strategy many successful investors employ is conservative underwriting to account for potential oversights and errors, along with multiple exit strategies.
Conservative evaluation and underwriting of a potential project begins with realistic ARV assumptions and an accurate analysis of comparable properties. At a minimum, investors should consider factors such as days on market and other carrying costs.
A backup plan is crucial for when market conditions change. For example, if demand slows, an investor could pivot to a fix to rent strategy to utilize the property as a long-term cash-flowing asset instead.
DSCR rental loans can help with this scenario, as eligibility is based primarily on the property’s ability to generate rental income, rather than the investor’s personal or business income.
Track the Right Performance Metrics
For a growing business, it’s important to track metrics that show whether projects are moving efficiently and protecting margins. Helpful benchmarks may vary by market and strategy, but many fix and flip operators use targets like:
Average project duration: Many investors aim for a full acquisition-to-sale timeline of roughly 90 to 120 days, when market conditions and renovation scope allow. Longer timelines can increase carrying costs and slow capital redeployment.
Budget variance: Track actual renovation costs against the original scope and budget. A variance above 5% to 10% may indicate issues with estimating, contractor performance, or change order control.
Net margin per deal: Many investors target a net margin of 15%-20% of ARV after acquisition, renovation, financing, and selling costs. This helps protect the deal if resale timelines extend or pricing softens.
Return on equity: This shows how effectively investor cash is being used. If equity is tied up too long or margins are shrinking, it may signal that capital could be deployed more efficiently.
Capital velocity: Track how quickly funds move from acquisition to renovation to sale or refinance. Faster capital recycling can allow investors to complete more projects without increasing their total cash position.
Partner With a Lender Who Understands Growth
Investors who transition from individual projects to multiple will find that financing becomes a core operational function of the business, rather than a one-time transaction. With multiple projects, investors must have access to funding that’s repeatable, consistent, and reliable.
Many investors consider business-purpose loans structured under an LLC. LendingOne’s investor loan programs are designed for investors and don’t require personal income documentation, such as W-2s or tax returns. Rather, qualification criteria are centered on the property itself, which can help streamline approvals and provide expedited access to funding.
Investors comparing different fix and flip lenders should prioritize those that can offer consistency and reliability. When investors know what to expect regarding timelines, underwriting requirements, required paperwork, and financing structures, they can make multiple acquisitions with greater confidence.
Investors looking to expand their business, especially across multiple markets, should consider a lender with a broad national reach that understands their unique needs, such as LendingOne. Submit a loan inquiry to get the process started and learn more about structuring financing for multiple projects.
FAQs About Scaling a Fix & Flip Portfolio
What changes operationally when moving from two deals to five?
As volume grows, operational complexity increases. Investors will find they need to coordinate multiple stages of each project. Stages can include contractor schedules, funding and draw requests, listing timelines, and more. Without mature systems, projects can easily fall behind.
How do experienced investors avoid burnout while scaling?
Investors can avoid burnout by engaging in time-saving activities such as delegating project-level oversight. Standardizing renovation decisions and focusing only on deals that fit a clearly defined buy box can also reduce the time and resources required. Having a comfortable amount of liquidity can also reduce financial stress if market conditions unexpectedly shift.
What credit score or qualifications do I need to scale a fix and flip portfolio?
While requirements vary by lender, many fix and flip loans focus more on the strength of the deal than traditional income documentation. Investors will typically need a solid credit profile, often in the mid-600s or higher, along with liquidity to cover down payments, closing costs, and reserves. As you scale, lenders may also evaluate your track record, including completed projects, timelines, and profitability.
How do market cycles affect scaling strategy?
In a favorable housing market, investors may be inclined to expand too quickly without conservative underwriting of properties. Experienced investors, however, know that this can increase risk exposure and should consider the broader long-term housing market cycle rather than recent short-term results.
Is there a point where fix and flip volume should transition into rental accumulation?
Depending on an investor’s goals, yes. Some investors choose to convert certain properties into long-term income-producing assets and refinance stabilized assets as part of a shift towards growing their portfolios. Flipping properties is one of several strategies, and some investors eventually shift towards a portfolio of long-term rentals.
Investors need capital that can move quickly, work around property issues, and fit a real business plan. That need is extremely valid.
But the bigger question is what kind of lender can deliver that speed with clear terms and repeatable execution.
This guide breaks down how hard money works, what it costs, what lenders require, where it helps, where it creates friction, and why many investors move toward more structured private lending as they grow.
What Is a Hard Money Loan?
A hard money loan is a short-term, asset-based loan secured by the property itself. The lender focuses heavily on the collateral, the project, and the exit plan, rather than relying on traditional income documentation.
That is why hard money often appeals to investors buying distressed homes, funding a fix and flip, or bridging to a refinance. These loans usually come from private lenders rather than banks and are designed for speed and flexibility.
The term “hard money” can cover a wide range of lenders, though. Some are highly organized. Others are more informal and less predictable.
Asset-Based Lending Explained
Hard money loans are a form of asset-based lending. They are underwritten primarily based on collateral, property value, and property-specific characteristics. This can include projected figures for renovation costs, after-repair values, investment potential, and an investor’s exit strategy. Investors with poor credit or unfavorable debt-to-income ratios can therefore have an alternative to traditional lending.
The key metric is after-repair value (ARV), which is the estimated market value of the property once renovations are complete. Lenders calculate how much they will advance based on ARV and your purchase price, expressed as loan-to-cost (LTC) or loan-to-value (LTV).
Your exit strategy matters as much as the asset. Lenders want to know how you will repay: Selling the property after rehab, refinancing into a long-term rental loan, or paying off the balance with proceeds from another deal. A clear exit strategy reduces lender risk and can improve your terms.
How Hard Money Lenders Differ From Traditional Banks
Compared to traditional lenders, hard money lenders can issue financing more quickly. Underwriting flexibility is also greater, as hard money lenders place a larger emphasis on a property’s value, condition, and investment potential, rather than a borrower’s personal credit and debt-to-income ratio.
The tradeoff, however, is that hard money loans often carry higher rates, greater fees, and shorter repayment terms. That combination can still make hard money a practical option for investment properties or transactions that do not fit traditional lending criteria.
You apply with property details and your investment plan. The lender underwrites the deal based on ARV and LTC. If approved, funds are disbursed at closing for the purchase and in draws for the rehab. You repay through sale, refinance, or payoff.
Typical Terms and Leverage
Terms vary, but the broad pattern is familiar:
Hard money loan terms usually reflect the project, the property, and the exit strategy.
Most hard money loans are short-term, often interest-only, and underwritten on leverage metrics: loan to cost (LTC), loan to value (LTV), or after-repair value (ARV).
Repayment terms typically run 6 to 24 months, which keeps the timeline tight and makes the exit plan the center of the deal.
Rehab funds are typically released through draws as work progresses, making the process and timing especially important.
How Rehab Draws Work
Rehab draws release funds once certain renovation work is completed, often requiring inspections as a condition of each draw. Many loans disburse on a fixed schedule once conditions are met.
To minimize the likelihood of cash flow disruptions, investors should have a clear understanding of how this works at each stage of the project, including when and which inspections are required, how reimbursement requests are processed, and how draw approvals are handled.
Common Uses of Hard Money Loans in Real Estate
Hard money stays relevant because it solves real problems for active investors. The use cases below are the most common.
Time-Sensitive Deals
Speed matters when a property cannot wait for a conventional process. That includes competitive offers, auctions, inherited properties, and off-market deals where the seller wants certainty. In these cases, hard money can help an investor act before the window closes.
Consider an investor bidding on a foreclosure at auction. The property needs a full rehab, and the seller requires closing in 10 days. A bank would decline the deal, but a hard money lender can fund it, giving the investor time to renovate and either sell or refinance.
Value-Add Investments
Distressed properties often need work before they qualify for long-term financing. Hard money helps cover the acquisition, and in many cases the rehab, so investors can improve the asset and create a cleaner exit. This is a common path for a fix and flip strategy.
BRRRR Strategy Execution
Buy, rehab, rent, refinance, repeat (BRRRR) investors often need short-term capital first, then long-term financing after the property is stabilized. Hard money can fill the acquisition and rehab phase, then roll into a rental refinance. The key is having a clear refinance path before the short-term loan matures.
Key Benefits of Hard Money Loans
Hard money remains attractive for a few simple reasons:
Speed to close: These loans are built for fast execution. Many hard money lenders can close in as little as 7 to 21 days, much faster than the typical 30 or more days for traditional financing.
Property flexibility: Distressed, non-warrantable, or unstabilized assets are often easier to finance. Traditional loans usually require properties to be in good condition and free of health or safety hazards.
Fewer traditional barriers: Many lenders care more about the project than W-2 income or strict debt-to-income (DTI) rules.
Structure around your strategy: Interest-only payments and rehab draws can support fix and flip or BRRRR timelines rather than fighting them.
Those are real advantages. The next question is how consistently you can get them from one deal to the next.
The Trade-Offs of Hard Money Loans
Hard money can address a timing issue, but investors should also consider execution risk, pricing clarity, and what happens after the first deal. Common issues with traditional hard money center around reliability, pricing, and scalability.
Reliability and Execution Risk
The hard money market can feel uneven, especially for investors trying to build repeatable financing relationships. Many hard money lenders are individual operators or small firms with different standards from one deal to the next.
Terms and support can vary from lender to lender.
Less standardized processes can make timelines and draws harder to predict.
Closing expectations may feel less consistent from one deal to the next.
A deal may close smoothly one time, then run into changed terms or delayed draws on the next. That inconsistency becomes harder to manage when you are juggling multiple projects or building a rental pipeline. This is often the point at which investors start looking for a more dependable direct lender connection.
Pricing vs. Predictability
Higher rates can raise total borrowing cost.
Hidden costs and high origination fees can make deals harder to model.
Unclear pricing can create pressure on already thin margins.
Short Timelines and Project Risk
Hard money loans often require repayment within 6 to 24 months and are not designed to be long-term loans. Construction and permitting delays can increase carrying costs and add pressure to repay on schedule. Investors planning to hold a property long term may find other loan programs more suitable.
Limited Scalability
One-off lending relationships can work for a single project.
They often offer fewer long-term options and less flexibility as needs change.
That can make it harder to move from one deal to repeat growth across flips or rentals.
This is why many experienced investors begin comparing hard money loan alternatives as their deal flow becomes more consistent.
Hard Money Loan Requirements
While hard money loan requirements vary by lender, most evaluate the same core aspects of a loan application. This includes the property’s value, the investment strategy, and the investor’s track record. Borrower qualifications still matter, but credit, available capital, property condition, leverage, renovation plans, and exit strategy are weighed alongside the strength of the deal.
Credit Score and Financial Profile
Hard money lenders may evaluate a borrower’s credit score, although it is often far less important than with a traditional loan. Strong credit can act as a compensating factor to offset weaknesses in a property, and it can help secure more favorable loan terms. Most firms require a minimum of around 620 to 660, with better terms typically starting above 680.
Lenders will also commonly review an investor’s financial profile, including their track record in real estate projects, experience level, and success rate. Investors with a proven track record of success are viewed more favorably than first-time investors.
Down Payments and Equity Requirements
Most hard money lenders require a down payment, typically ranging from 10% to 25% of the purchase price. This reduces the lender’s risk in the event of a default by allowing them to resell the property to cover their financial losses. For investors, the down payment is commonly referred to as having “skin in the game” and helps align the interests of both the lender and investor.
Leverage is capped separately through loan-to-cost or loan-to-value limits, commonly 60% to 75% of the property’s current value.
Property Type and Investment Strategy
Hard money lenders may restrict the types of properties eligible for financing. Common property types include single-family homes, multifamily properties, townhomes, and condominiums. For rehab projects, lenders may review the renovation scope, budget, contractor, and any other investment property loan requirements before approving financing.
The investment strategy can also affect loan approval and terms. For example, a fix and flip project may be evaluated based on the renovation costs and ARV. A long-term rental may place greater emphasis on projected rental rates, vacancy, and rental income.
Cash Reserves and Liquidity
Regardless of whether it is required for loan approval, investors should maintain adequate cash reserves, commonly 3 to 6 months of payments or holding costs, to cover unexpected expenses, carrying costs, renovation expenses, and other daily operating expenditures. Strong liquidity can also provide an additional layer of protection in the event of construction delays or changes in market conditions.
A Defined Exit Strategy
Lenders want a repayment path on record before they fund: sale after rehab, refinance into a long-term rental loan, or payoff from another source. The exit strategy shows how the loan will be repaid once the project is complete, and a credible one can offset weaker borrower qualifications.
Hard Money Loan Rates, Costs, and Fees
Investors should understand all the costs involved in a hard money loan, as they could impact a project’s profitability. Below are the most common expenses associated with obtaining one.
Interest Rates
Hard money loans usually have higher rates. These loans are viewed as carrying a greater risk of default due to underwriting flexibility and the speed at which financing is issued, so lenders charge more to offset that risk. Rates typically range from 9% to 14%, depending on leverage, experience, and exit strategy.
Rates can be lowered based on a borrower’s credit, financial reserves, and investment track record.
Origination Points
Many hard money lenders charge origination points, a percentage of the loan amount, to cover administrative costs. This is a one-time fee charged upfront and is typically one of the largest fees to consider in an investor’s analysis.
Rehab Draw Fees
On a renovation project, fees may be charged each time funds are disbursed from a line of credit or rehab draw. Understanding the schedule of fees and when disbursements are made can help investors avoid excessive and unexpected expenses.
Closing Costs
As part of the loan review and approval process, lenders may incur fees, many of which are then passed on to the investor. Common fees include title expenses, recording charges, appraisal and inspection fees, and other third-party services.
Extension Fees and Carry Costs
In the event that a project is delayed and a loan needs to be extended, the lender may charge extension fees. Investors should also consider ongoing carrying costs, such as insurance, taxes, utilities, and maintenance.
Hard money loans prioritize speed and flexibility, and those benefits come at the cost of higher loan fees. The rate alone is a poor comparison tool. A loan can look attractive upfront, but the real cost becomes clearer once fees, timeline risk, and the refinance or sale plan are factored in.
How to Get a Hard Money Loan
Hard money loans can be issued quickly, and preparation is what keeps the process moving. Consider the following best practices before you apply.
Make Sure Your Deal Has Enough Margin
In addition to having a sufficient pad for fluctuating rates and costs, investors should confirm there is a real profit margin. Pressure-test your assumptions about renovation costs, holding periods, carryover costs, and expected resale value.
Plan Your Exit Strategy Early
Having a clearly defined exit strategy ensures the loan will be repaid on time. Common exit strategies include refinancing into a long-term loan, selling the property, or holding it as a long-term rental.
Build Extra Liquidity Into Your Budget
Plan for unexpected expenses so your project will not be derailed easily. Maintain sufficient cash reserves to cover extra construction costs, project delays, and other holding costs.
Compare Total Financing Costs, Not Just Rates
Consider a loan’s total costs. This includes one-time fees such as origination, draw, and extension fees, as well as other closing costs and the recurring interest charges that result from the rate. Comparing fix and flip lenders on total cost of capital, rather than headline rate, tends to change the answer.
Think About Long-Term Scalability
Beyond an individual project, investors should consider how a financing strategy can help grow their portfolio further. This can include refinances, as well as the acquisition of fix and flip or long-term rental properties.
Evaluating these factors can help investors avoid costly mistakes and choose financing that best aligns with their investment strategy.
Hard Money vs. Institutional Private Lending
Many investors still use “hard money” as shorthand for fast private capital. In practice, there is a difference between fast money and organized private lending. That difference becomes clearer once you plan for repeat deals.
Traditional Hard Money
LendingOne Private Lending
Underwriting
Often informal and lender-specific
Asset-based, with clearer criteria and an investor strategy review
Speed
Fast, but it can vary by lender
Fast, with a defined process. As few as 5 days on eligible fix and flip deals
Communication
Can be uneven
More structured and transparent
Leverage
Commonly up to 75% of property value
Up to 92.5% LTC on fix and flip, up to 95% LTC on fix to rent
Rehab financing
Commonly up to 75% of the after-repair value (ARV)
Up to 100% of renovation costs on eligible deals
Property types
Single-family, condos, townhomes, some multifamily
Single-family, 2- to 4-unit rentals, condos, townhomes
Long-term refinance path
Depends on the lender and available programs
DSCR rental loans available in-house
Scalability
Often transactional
Built for repeat borrowers
Speed and Certainty
Both can close quickly. The difference is in the process. A more structured lender can move fast while still giving investors clearer milestones, cleaner documentation, and fewer surprises at the finish line.
LendingOne fix and flip funding can happen in as little as five days, with many short-term loans closing in roughly 10 to 14 business days once the file is ready.
Underwriting Approach
Hard money underwriting can feel very lender-specific. Institutional private lenders still focus on the asset and exit plan, but they do it with more defined standards. That makes it easier to understand leverage, documentation, and next steps before the deal gets deep into the process.
Ability to Scale
Hard money often works as a transaction. Institutional private lending works better as a system. If you expect to complete several deals a year or move from flips into rentals, repeatable execution is crucial. LendingOne’s mix of fix and flip, fix to rent, debt service coverage ratio (DSCR), and portfolio products is designed around that progression.
Transparency and Communication
Investors need to model real costs and real timelines. More structured private lending makes that easier because the process is clearer from quote to close to draw. That can matter as much as the rate when the project timeline is tight.
Hard Money Loan Alternatives
Many investors do not need to abandon fast capital. They need a cleaner version. Structured private lending gives them organized speed: clear steps, defined underwriting, efficient rehab draws, and a path into the next stage of the strategy.
LendingOne offers several loan programs designed for real estate investors. Each one fits a different strategy.
Fix and Flip Loans
Fix and Flip loans are built for acquisition, renovation, and resale. The lender closely examines the project budget, the ARV, and the exit strategy because they drive both leverage and risk. The program offers up to 92.5% LTC, up to 100% rehab financing, interest-only payments, no tax returns, and funding in as few as 5 days for eligible deals.
For example, an investor buying a $250,000 property with a $50,000 rehab budget has a total project cost of $300,000. At 92.5% LTC, the loan could cover $277,500 of that amount, including the rehab funds. The investor would bring the remaining 7.5% ($22,500) in cash. That structure can help preserve liquidity for the next project rather than tying up all available capital in a single deal. Investors comparing short-term financing may also want to review what to consider when evaluating a fix and flip loan.
Fix to Rent Loans (Bridge to Long-Term Holds)
Fix to Rent loans work well for BRRRR investors who want one lender from rehab through refinance. The structure offers up to 95% LTC, a nine-month interest-only term, and discounts tied to the refinance into a long-term rental loan. That creates a more deliberate bridge from value-add work to stabilized cash flow.
DSCR Rental Loans (Exit Strategy)
A DSCR loan supports the long-term hold. Qualification is based on the property’s cash flow rather than personal income documentation, which is useful for investors looking to grow beyond one or two rentals. LendingOne’s DSCR loans offer:
Up to 80% LTV on purchases and rate-term refinances
Up to 75% LTV on cash-out refinances
30-year fixed financing structured specifically for investment properties
Options for long-term rentals, short-term rentals, and portfolio growth
New Construction loans are designed for experienced investors and developers building residential investment properties. Financing can provide up to 90% LTC, with staged construction draws and interest-only payments during the build to align financing with project progress.
SFR Portfolio Loans
Portfolio Rental loans are designed for investors financing multiple rental properties under one loan. The program offers long-term fixed or ARM structures with flexible terms, giving portfolio investors a consolidated financing option built specifically for rental assets.
When Hard Money Still Makes Sense
Hard money still fits certain deals. A niche property, an unusual risk profile, or a one-time opportunity may call for a lender willing to move outside a more standardized process.
It can also make sense when speed outweighs everything else, and the investor fully understands the cost. The key is using hard money as a strategic tool for a specific scenario, rather than making it the default answer for every acquisition. If you are planning your next project, explore how to refinance investment property effectively.
Why Investors Choose LendingOne Instead of Hard Money Lenders
Traditional hard money lenders solve one problem: fast capital. LendingOne solves that problem and several others.
LendingOne lends directly. There is no broker in the middle and no marketplace matching you with unknown capital sources. You work directly with the LendingOne team from application to closing to payoff. Unlike lenders that cater to many kinds of borrowers, LendingOne focuses solely on real estate investors, with underwriting built specifically for investment properties.
LendingOne offers a refinance path. Many hard money lenders fund your acquisition, then leave you to find a separate lender for your long-term hold. LendingOne’s DSCR rental loans let you refinance in-house once your property stabilizes. Instead of relying on a series of unconnected short-term loans, investors can use one lender across repeat acquisitions and portfolio growth.
The company also builds for long-term relationships. Their deal analysis tools, dedicated loan advisors, and investor resources exist because they want to fund your next deal, not just this one.
Hard Money
LendingOne Private Lending
Lending model
Broker or marketplace
Direct lender
Short-term financing
Yes
Yes
Long-term refinance option
Depends on what programs the lender offers
Yes, through DSCR rental loans
Investor support
Transaction-focused
Relationship-focused
Deal analysis tools
Depends on the lender
ARV, DSCR, and cash flow calculators
Get the Right Financing for Your Real Estate Portfolio
The best financing choice depends on what the deal needs now and what your portfolio needs next.
Short-term execution matters. So do clear terms, dependable draws, and a path into the next loan structure when the business plan changes.
LendingOne supports the full cycle with investor-focused options across fix and flip, fix to rent, DSCR, and portfolio lending, plus refinance paths that can free up capital for the next move.
What is the difference between hard money and bridge loans?
The terms often overlap. In investor lending, hard money is typically short-term bridge financing secured by real estate. The practical difference usually comes down to who provides the capital, how formal the underwriting is, and whether the lender can support a longer-term strategy after the first short-term loan ends. Our guide to bridge vs. hard money loans walks through where each one fits.
Do hard money lenders require income verification?
Usually not in the same way banks do. Hard money lenders focus more on the property, the leverage, and the exit strategy than on traditional income documents. Depending on the loan structure, some investor programs may not require W-2s or tax returns at all, which makes financing more accessible for self-employed borrowers and active investors buying business-purpose properties.
How fast can you close with a hard money lender?
Timing depends far more on file readiness than on the lender. Appraisal, title, insurance, and a documented rehab budget are what usually set the pace. LendingOne-eligible fix and flip deals can fund in as little as 5 days, and many short-term loans close in about 10 to 14 business days once appraisal and underwriting are ready.
Are hard money loans good for fix and flip projects?
Yes. Hard money is a popular choice for flips because it provides quick access to capital and flexible underwriting on properties a bank would decline. The caution is margin. On a thin deal, the higher rate and fees can consume the profit, so run the numbers on total financing cost before committing.
What are the best hard money lenders?
The best hard money lender is the one whose programs align with your strategy, whether that is a single flip or a growing rental portfolio. Investors who plan to do repeat deals tend to favor lenders that can carry them past the first transaction. LendingOne is a strong alternative for investors seeking financing designed specifically for real estate investing, portfolio growth, and long-term scalability.
March was supposed to be the month the housing market found its footing. It wasn’t. Existing-home sales fell back to their slowest March pace since 2009, mortgage rates snapped higher after briefly dipping below 6%, and buyers stayed cautious.
But the bigger story isn’t the headline. It’s what’s underneath it.
Inventory is building in the markets that overbuilt. Price resilience is holding in the markets that didn’t. Single-family rents are still outperforming multifamily. And builders are getting more cautious again. For investors, that means 2026 is looking less like a broad-based housing rebound and more like a market-selection year.
Existing Home Sales: The Slowest March Since 2009
Existing-home sales fell 3.6% in March to a 3.98 million annualized pace, down 1.0% from a year ago and the weakest March reading since 2009. Sales fell in all four regions month over month, with the steepest drop in the Northeast. Homes also took longer to move, with median days on market rising to 41 from 36 a year ago.
What it means: transaction volume is soft, and negotiating leverage is starting to shift. Sellers who listed for a stronger spring are facing a market that looks more selective and more price-sensitive.
Home Prices: Still Rising Nationally, but the Map Matters More
The national median existing-home price rose to $408,800 in March, up 1.4% year over year and a record for the month. But that national number hides a widening regional split. The Northeast and Midwest are still showing stronger price appreciation, while the South is barely up and many Sun Belt markets remain under pressure.
AEI’s latest metro data tells the same story: Kansas City remains one of the leaders at +8.6% year over year, while Cape Coral is still one of the weakest at -9.6%.
What it means: national appreciation is no longer enough of a thesis on its own. In 2026, returns will be driven far more by metro selection than by macro beta.
Inventory: Better, but Not Balanced
Inventory rose to 1.36 million homes in March, up 3.0% from February, with months’ supply increasing to 4.1. That is real improvement, but it is still well short of a balanced market. National inventory also remains below 2019 levels.
The more important detail is where inventory is normalizing. Nine states are now above pre-pandemic inventory levels, including Florida, Texas, Colorado, Arizona, and Utah. Those are the places where pricing power is softening fastest and entry points are getting more interesting.
What it means: the opportunity is no longer “housing” in general. It is the subset of metros where supply has finally reset faster than sentiment has.
Mortgage Rates: The Window Opened, Then Closed
Freddie Mac’s 30-year fixed mortgage rate dipped to 5.98% in late February, the first sub-6% reading in years. That window shut quickly. By early April, the rate was back to 6.37%. Fannie Mae still expects rates to drift lower by year-end, with a forecast around 5.7% by Q4, but that is a tailwind, not a base-case underwriting assumption.
What it means: underwrite at today’s rate environment, not tomorrow’s hoped-for one. The best buyers this year are the ones building margin into the deal from day one.
Rents: Single-Family Is Still the Stronger Story
Recent rent data still favors single-family. Zillow’s January data showed single-family rents up 2.7% year over year and overall asking rents up 2.0%, while its February report showed multifamily rent growth slowing to 1.4% annually as apartment supply continues to weigh on the sector.
What it means: rent growth is still there, but it is narrower, more local, and increasingly tied to supply discipline. That keeps the best SFR setups concentrated in metros where new apartment supply is less overwhelming and for-sale affordability is still pinching would-be buyers.
New Construction: Builders Are Getting More Defensive
Builder sentiment stayed weak in March, with the NAHB Housing Market Index at 38. More than a third of builders cut prices, and nearly two-thirds used incentives. Fannie Mae’s March forecast now calls for single-family starts to fall 6.2% in 2026 before rebounding 5.1% in 2027. Meanwhile, 2025 single-family permits totaled 909,600, down 7.4% from 2024.
What it means: in the near term, builder incentives create selective buying opportunities. Over the longer term, slower starts reinforce the scarcity value of existing housing stock.
The Big Picture
March didn’t bring a clean spring breakout. It reinforced a market that is still fragile, still uneven, and still highly local. Sales are slow. Inventory is improving, but mostly in the places that got ahead of themselves. Rents are holding up best in single-family. Builders are getting more cautious.
That leaves investors with the same conclusion as the last two months, only clearer: the opportunity in 2026 is not in the headline. It is in the metros. The best setups are where supply is normalizing, rent growth is still positive, and pricing has already done enough resetting to create real margin on entry.
Choosing between a debt service coverage ratio (DSCR) loan versus a conventional loan can directly affect your level of success as an investor.
Each differs in eligibility criteria, closing and funding speeds, and flexibility with loan terms. These factors directly impact how competitive your offers are, as well as how quickly you can scale a portfolio.
This guide compares DSCR and conventional loans from the perspective of a property investor. It emphasizes critical factors, such as underwriting flexibility, scalability, and real-world scenarios.
Key Takeaways
DSCR loans are qualified based on the property, not the borrower. Investors who cannot qualify based on personal income may still qualify using the property’s cash flow.
Conventional loans can limit growth. Many conventional loans cap the number of financed properties, making it difficult for investors to build a larger portfolio.
Approval and funding speeds matter in competitive markets. DSCR loans typically close more quickly, reducing the likelihood of missing out on a good investment deal.
What Is a DSCR Loan?
In financing investment real estate, a DSCR loan evaluates the property’s cash flow rather than the investor’s personal income. DSCR is a financial figure that measures whether a property can generate sufficient income to cover its monthly debt obligation.
In addition to a property’s rental income, DSCR loans consider its operating expenses and proposed loan payment. Lenders can use this information to determine if the property is an acceptable risk and meets their guidelines.
This flexibility often appeals to investors who may otherwise be ineligible for conventional financing, which reviews personal income and debts to determine the ability to repay the debt.
Lenders use a property’s DSCR ratio to measure whether its expected rental income can fully cover its debt payments. Lenders generally view properties with higher DSCR ratios more favorably.
Here is a basic DSCR formula:
DSCR = Monthly rental income ÷ monthly debt obligations
A ratio of 1.0 means the property should break even, with rental income being exactly equal to debt payments. Higher ratios indicate the property will have a positive cash flow. You can determine your own DSCR ratio with LendingOne’s DSCR calculator.
Pros and Cons of DSCR Loans
DSCR loans won’t be for everyone. Consider the following pros and cons to help decide whether it’s right for you:
Pros
Does not require personal income: Lenders base approval on the property’s ability to generate rental income rather than on your personal income and debt.
Well-suited for portfolio investors: Conventional loans have less flexibility in terms and qualification requirements, making DSCR loans more investor-friendly.
Faster approval and funding speeds: DSCR lenders are often well-versed in the nuances of investment loans, allowing them to fund and close more quickly.
Cons
Higher interest rates: More costly pricing is a reflection of the increased underwriting and loan term flexibilities. Learn more about how DSCR loan interest rates are determined.
Larger down payment requirements: From a risk management perspective, and to balance increased underwriting and loan term flexibilities, many lenders require larger upfront down payments.
What Is a Conventional Loan?
A conventional loan is a mortgage typically offered by banks and credit unions. These loans are often issued based on a borrower’s personal income and debts.
Common underwriting requirements involve an evaluation of a borrower’s income, employment history, credit score, and debt levels. In other words, lenders determine a borrower’s ability to repay a loan based on personal factors, rather than the property’s ability to generate income.
Compared to DSCR financing, conventional loans have some notable limitations. For instance, many programs and lenders have a cap on how many financed properties a borrower can have.
Paperwork requirements are also generally more extensive, leading to a more time-consuming process for approval and funding. Conventional loans also do not typically have as much flexibility for underwriting or available loan terms.
Pros and Cons of Conventional Loans
Just like with DSCR loans, conventional loans also have their own set of pros and cons. Below are some of the key factors that should be considered for conventional financing.
Pros
Lower interest rates: Conventional loans often carry lower rates due to lower perceived risk from higher paperwork requirements and strict underwriting methods.
Smaller down payment requirements: Down payment requirements tend to be smaller, which can be beneficial for investors strapped for cash.
Cons
Strict income and documentation requirements: Lenders depend on documented stable income, employment, and low debt levels for approvals, which can be difficult for investors.
Limits on the number of financed properties: Conventional lenders typically cap the number of properties an investor can have as a requirement for loan approval.
Less flexibility for portfolio investors: Compared to DSCR loans, underwriting and loan term flexibility is significantly lower, which can hinder an investor’s ability to scale quickly.
DSCR Loan vs. Conventional Loan at a Glance
Borrowers can use either a DSCR or a conventional loan to finance investment properties. However, each has notable differences in things like qualification requirements, funding speeds, and other nuances that can impact portfolio growth.
DSCR Loan
Conventional Loan
Primary Qualification
Property cash flow (DSCR)
Borrower income and DTI
Income Documentation
Not required
Required (W-2s, tax returns, paystubs)
Debt-to-Income Ratio
Not applicable
Strict DTI limits apply
Underwriting Focus
Rental income versus debt payments
Personal income, employment, and credit
Eligible Properties
Non-owner-occupied investment properties
Primary residences and limited investment use
Ownership Structure
Can close under an LLC
Typically must close personally
Portfolio Scalability
Designed for multiple properties
Loan count limits restrict scaling
Speed to Close
Faster, streamlined process
Slower bank-driven timelines
Flexibility for Self-Employed Borrowers
High
Low to moderate
Use Case
Rental acquisitions, refinances, BRRRR strategies
Long-term holds with high personal income
Ideal Investor Profile
Investors focused on growth and cash flow
Investors prioritizing rate over flexibility
Qualification and Underwriting
By evaluating a property’s cash flow to determine eligibility, DSCR loans give investors more flexibility to qualify and expand their portfolios more quickly.
Conventional loans, however, evaluate an investor’s sources of personal income and debt levels to determine their ability to repay the loan.
Scalability and Portfolio Growth
Conventional loans often have requirements that limit how many financed properties a borrower can have. If a borrower exceeds that limit, a conventional lender will not issue additional financing.
DSCR loans typically don’t impose the same limits. This makes DSCR loans more suitable for investors looking to grow and scale a portfolio of rental properties.
Speed and Certainty of Closing
Conventional loans often have slower funding timelines, in part because the loans are more often used for primary and secondary residence financing. In other words, conventional lenders may not be privy to the nuances and urgency of funding needed for investors.
DSCR loans, by contrast, often cater to real estate investors. Since these lenders have a greater understanding of the importance of timely funding, DSCR lenders can often fund and close more quickly and consistently.
Ownership Structure and Liability
DSCR loans have more flexibility in allowing borrowers to close loans in the name of an LLC or corporation. Doing so affords more protection for an investor’s personal assets.
Conventional loans often require loans to be closed under a borrower’s personal name, which can result in personal financial liability.
Down Payment Requirements
DSCR loans can require down payments ranging from 20% to 30% or more. Payments depend on the property’s characteristics, deal complexity, and overall strength of the loan application.
Conventional loans can have far lower down payment requirements of around 10% or less, depending on the details of the loan.
Credit Score Requirements
DSCR loans typically require a minimum credit score of 650 or higher. However, many lenders offer a degree of flexibility depending on the strength of compensating factors you may have, such as a larger down payment.
Conventional loans can have requirements as low as 620. Credit score requirements can depend on things like property type and occupancy, but they have little to no flexibility.
Interest Rates and Fees
DSCR loans typically carry higher rates due to the added risk of the flexibility in underwriting and loan terms.
Conventional loans usually have lower rates. However, they may have additional fees, such as loan-level pricing adjustments and points, that are tied to loan characteristics.
Property Eligibility
DSCR lenders design these loans for rental properties, including single-family homes, townhomes, condominiums, and multi-unit properties.
Conventional lenders typically use these loans for primary and secondary residences, with some flexibility for investment property usage. For this reason, many investors find DSCR loans to be a better fit for expanding a portfolio of rental properties.
When a DSCR Loan Is the Better Fit
DSCR loans are often a strong fit for investors who:
Want to build and grow a portfolio of rental properties without worrying about limitations on personal income or the number of financed properties.
Have income or employment that can be difficult to document or is particularly complex.
Are using BRRRR and fix-to-rent as a rental portfolio strategy.
Ultimately, investors looking for speed, flexibility, and expertise in partnering with a lender typically find DSCR loans to be more ideal.
When a Conventional Loan May Make Sense
While DSCR loans may be well-suited for a majority of investors, conventional loans can still make sense in several scenarios for investors who:
Have a smaller portfolio of properties and who won’t have to worry about running into loan limitations.
Have high personal income and easily documentable employment.
Are cost-conscious and can benefit from more competitive rates for long-term holds.
Investors who prioritize lower rates, stable income qualification, and long-term holds over portfolio scalability and underwriting flexibility will find that a conventional loan meets their needs.
Why Real Estate Investors Choose LendingOne DSCR Loans
Seasoned investors know that the best fix-and-flip lenders aren’t always the ones with the lowest interest rate. The right loan needs to align with the investor’s strategy, as different lenders and loan programs offer varying levels of speed, flexibility, and predictability in the underwriting and funding processes.
LendingOne designs its DSCR loans to support investors throughout the entire process. Investors can use these loans as a repeatable tool for long-term portfolio growth, rather than a one-time transaction. With that being said, LendingOne focuses on being a true strategic partner and not just a source for capital.
FAQs About Choosing Between a DSCR and a Conventional Loan
Can I refinance a conventional loan into a DSCR loan later?
Yes, if property meets DSCR requirements. Many investors start with conventional loans, only to later refinance into a DSCR loan once the property has stabilized or rents have increased to meet DSCR requirements. Doing so removes some of the restrictions of conventional loans, such as the cap on the number of financed properties.
Do DSCR loans work for short-term rentals or Airbnb properties?
Yes. However, lenders determine eligibility based on their specific guidelines and local market conditions. They also require reliable market data or operating history to support the projected income.
What happens if my DSCR is below 1.0?
A DSCR ratio below 1.0 means that the rental income generated by a property will not be enough to cover the property’s debt obligation amount. Lenders each have varying thresholds for DSCR ratios, so it’s still possible to get approved below 1.0.
Are DSCR loan rates always higher than conventional rates?
In most cases, DSCR loan rates will be higher than conventional rates. However, this can depend on the property characteristics and the strength of the loan application.
Despite the higher rates, many investors still choose DSCR loans due to the increased flexibility and ability to close more quickly.
H3: Can I use projected rents instead of current leases?
In many cases, yes. DSCR lenders can use projected rents if supported by market appraisals of typical rent amounts.
This approach is more common for BRRRR and fix-to-rent properties. In these investments, recent property improvements might not yet reflect the new true market rent potential.
Cookie Consent
We use cookies to improve your experience, personalize content, and analyze site traffic. By continuing to browse our site, you consent to our use of cookies.